Splunk Integration
Overview
The Splunk connector in FortiSOAR enables powerful SIEM integration capabilities, allowing you to run ad-hoc queries using Splunk Query Language (SPL) and automatically trigger playbooks based on search results. This integration transforms raw log data into actionable security intelligence.
What You’ll Learn
- Configure Splunk HTTP Event Collector for log ingestion
- Set up FortiSOAR-Splunk connector authentication
- Create automated alert generation from Splunk searches
- Build playbooks that respond to Splunk findings
Prerequisites
- FortiSOAR instance with admin access
- Splunk Enterprise or Cloud instance (Cloud Instance trial does not have API access enabled)
- Basic understanding of Splunk Query Language (SPL)
- Network connectivity between FortiSOAR and Splunk
Lab Environment Setup
Option 1: Splunk Enterprise on AWS (Recommended for Testing)
For this guide, we’ll use a Splunk Enterprise trial on AWS, which provides:
- Cost: Free trial for 60 days (AWS infrastructure costs only)
- Features: Full Enterprise capabilities
- Scalability: Easily adjustable instance sizes
- Access: Complete administrative control
Quick AWS Deployment
Launch Splunk from AWS Marketplace
- Search for “Splunk Enterprise” in AWS Marketplace
- Select appropriate instance size (t3.medium minimum recommended)
- Configure security groups to allow ports 8000 (Web UI) and 8088 (HEC)
Initial Access
- Default credentials:
admin/<instance-id> - Change password on first login
- Complete the initial setup wizard
- Default credentials:
Part 1: Configure Splunk Data Ingestion
Step 1: Enable HTTP Event Collector (HEC)
The HTTP Event Collector allows external systems to send data directly to Splunk via REST API.
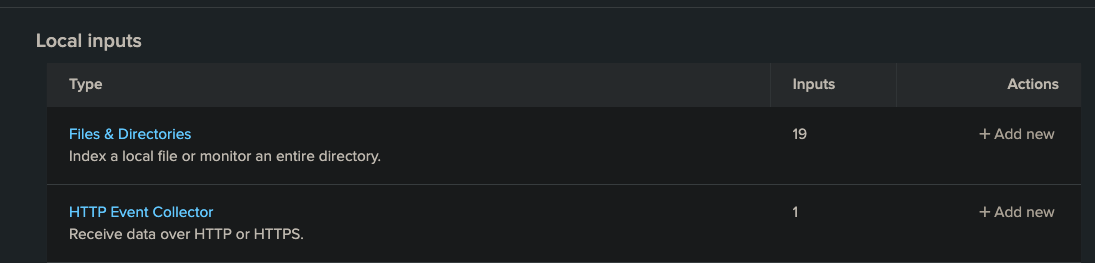
Navigate to Data Inputs
Settings → Data Inputs → HTTP Event Collector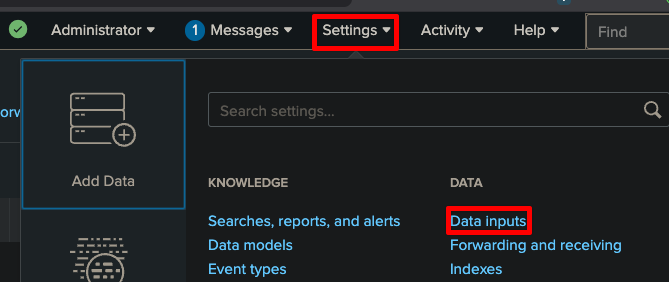
Add New Token
Configure Token Settings
- Name:
FortiSOAR-Integration - Description:
Token for HTTP log ingestion and queries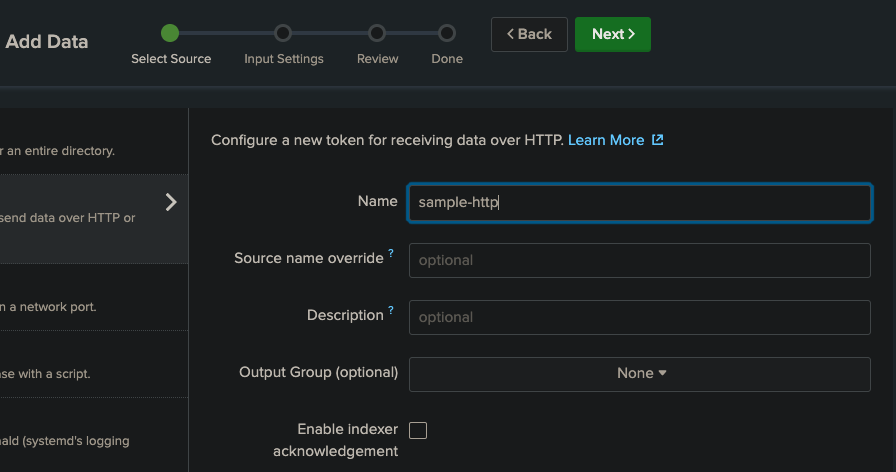
- Name:
Set Input Settings
- Source Type:
fortinet:firewall(for FortiGate logs) - Index:
main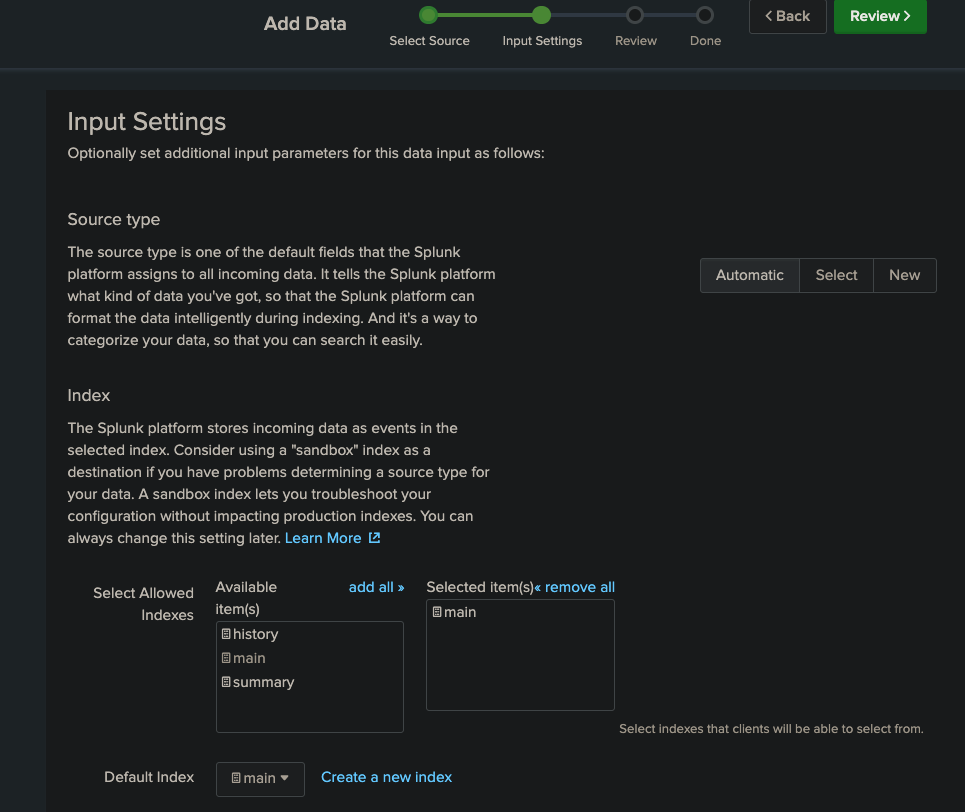
- Source Type:
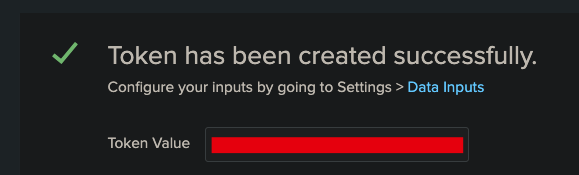
Review and Create
- Verify all settings
- Click Review → Submit
- Save the token: You’ll need this for API log uploads
Step 3: Test HEC Connectivity
Verify your HEC setup with a simple test:
curl -k "https://<splunk-server>:8088/services/collector" \
-H "Authorization: Splunk <your-hec-token>" \
-d '{"event": "Test event from FortiSOAR setup", "source": "fortisoar_test"}'
Expected response:
{
  "text": "Success",
  "code": 0
}
Part 2: Configure FortiSOAR Splunk Connector
Step 1: Install Splunk Connector
Navigate to Connectors
Automation → Connectors → ManageSearch and Install
- Search for “Splunk”
- Click Install on the official Splunk connector
- Wait for installation to complete
Step 2: Create Splunk Configuration
Connector Settings
Configuration Name: Splunk-Production
Server URL: https://your-splunk-server:8089
Username: your-splunk-username
Password: your-splunk-password
Protocol: https
Splunk API Port: 8089
Verify SSL: False (unchecked)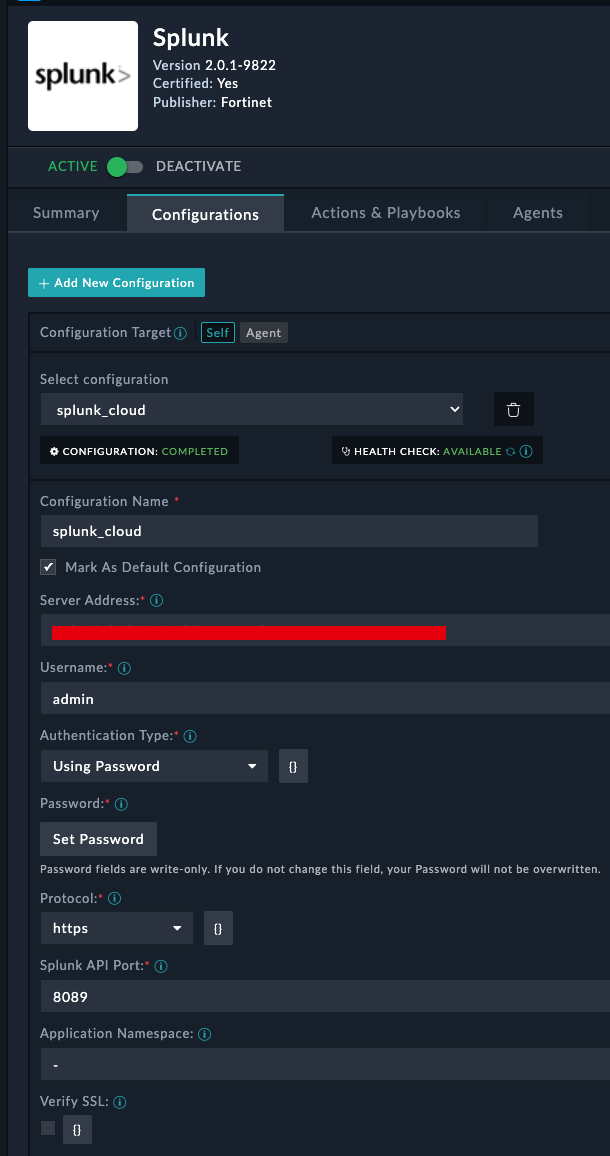
Click Save, and verify you the Health Check passes
Part 3: Generate Sample Logs
Note
You can skip this step if you already have logs in Splunk
Create a Python script to continuously feed FortiGate logs to Splunk:
Tip
This python could be ran directly from the Code snippet step in fortisoar
Enhanced Log Forwarder Script
#!/usr/bin/env python3
"""
FortiGate to Splunk Log Forwarder
Reads FortiGate logs and forwards them to Splunk HEC
"""

import random
import requests
from datetime import datetime

# Configuration
SPLUNK_HEC_URL = "https://your-splunk-server:8088/services/collector"
SPLUNK_HEC_TOKEN = "your-hec-token-here"

# Device names (simulate 5 FortiGate firewalls)
devices = [f"FG100F-{i:03d}" for i in range(1, 6)]

# Sample BPDU event template
log_template = (
    '<134>date={date} time={time} devname="{devname}" devid="{devid}" '
    'eventtime={eventtime} tz="+0000" logid="0419016384" type="event" '
    'subtype="system" level="alert" vd="root" logdesc="BPDU packet received" '
    'msg="BPDU packet received on {port}, shutting down the port."'
)

# Generate 20 logs
for _ in range(20):
    now = datetime.utcnow()
    devname = random.choice(devices)
    devid = f"{devname}-SN{random.randint(100000, 999999)}"
    port = f"port{random.randint(1, 5)}"

    log = log_template.format(
        date=now.strftime("%Y-%m-%d"),
        time=now.strftime("%H:%M:%S"),
        devname=devname,
        devid=devid,
        eventtime=int(now.timestamp() * 1_000_000),
        port=port
    )
    print(log)

    payload = {
        "event": log,
        "sourcetype": "fortinet:firewall"
    }

    response = requests.post(
        SPLUNK_HEC_URL,
        headers={"Authorization": f"Splunk {SPLUNK_HEC_TOKEN}"},
        json=payload,
        verify=False  # Set to True if you have proper TLS setup
    )

    if response.status_code != 200:
        print(f"Error: {response.status_code} - {response.text}")
    else:
        print(f"Sent log from {devname}")
Warning
Make sure to update your server url and API token in the code snippet to match your environment
Verify logs in splunk
After running the script, lets check that we see logs in Splunk
- Navigate to Search and Reporting
- Search for
sourcetype="fortinet:firewall"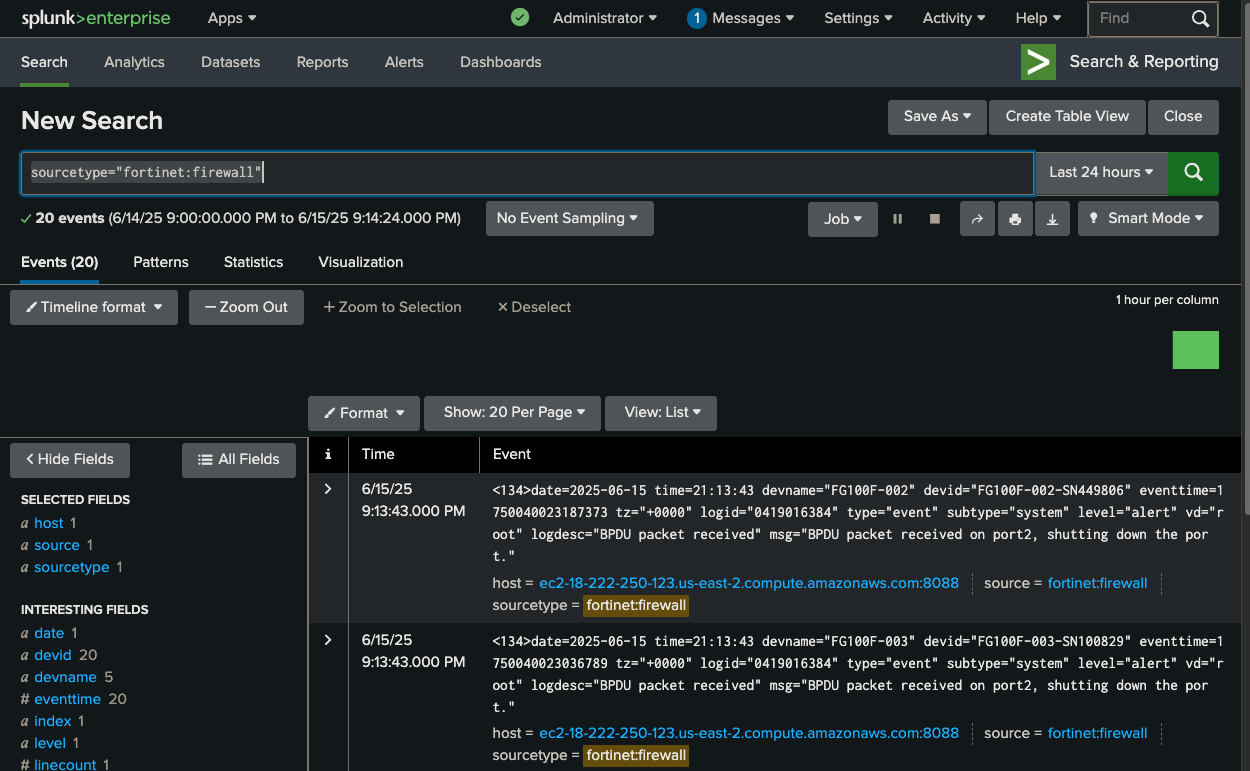
Query Splunk from FortiSOAR
Create a new playbook. Name it
BPDU Splunk Queryfor easy searching laterYou can use the Referenced Start step for testing
Drag a new step from the Start, and select Connector
Select Splunk
- Add a name like
Query BPDU Packets - Select the Action Invoke Search
- Use this query for the search
index=main sourcetype=fortinet:firewall "BPDU packet received" | bin _time span=1m | stats count as bpdu_count by devname, _time | where bpdu_count > 3 | stats sum(bpdu_count) as total_bpdu_events by devname- Delete the text inside the Earliest Time Field. The default time won’t work with the query. Your configuration should look like the image below.
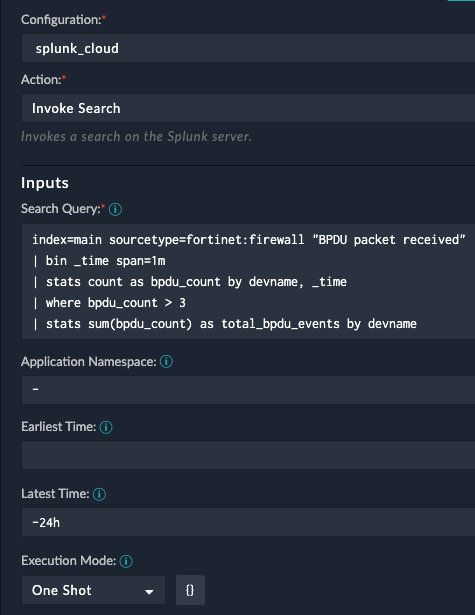
- Add a name like
Save the step
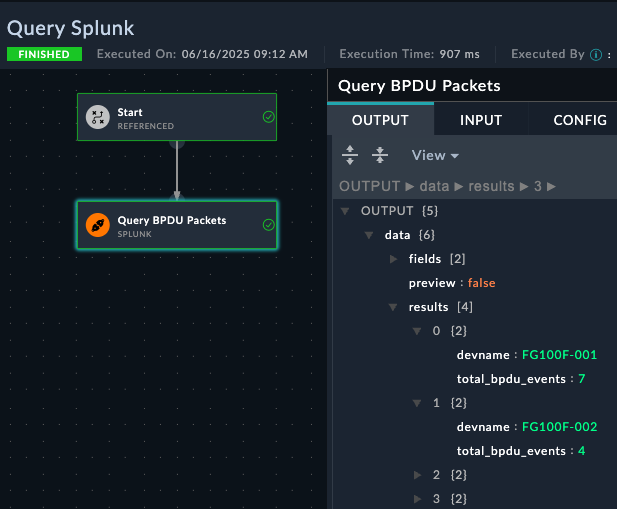
Save and run the playbook.
Check the playbook results. If your query worked you will see output like this
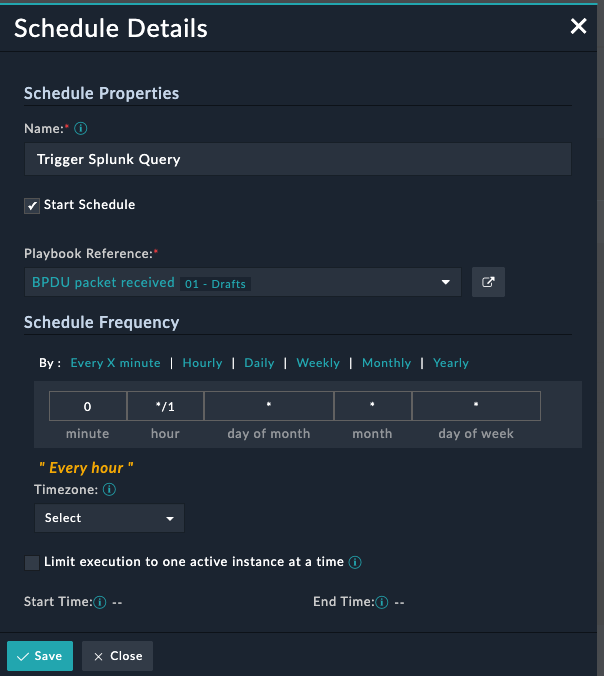
Create a Schedule to automate running this playbook
- Navigate to Automation > Schedules
- Click Create New Schedule at the top right
- Name
Trigger Splunk Query - Start Schedule : Enabled (True)
- Playbook Reference: Search for you playbook name
BPDU packet received - Select Schedule Frequency: Hourly
- Name
- Click Save