Understand the platform’s foundational structure:
Automation Design Pattern Introduced: System Object Awareness – Understand the building blocks you’ll manipulate in automation.
Hands-on introduction to working in FortiSOAR:
Goal: Build comfort with the interface before introducing logic-based design.
Introduces the building blocks of automation logic:
Scheduling & Triggers:
Playbook Step Types:
Jinja Templating:
Automation Design Patterns Introduced:
- Event-Driven Automation (trigger-based)
- Declarative Logic with Conditions & Remediation
- Data Parsing & Dynamic Input via Jinja Templates
Put theory into practice:
Goal: Apply generalized patterns in a structured task.
Work through real-world automation examples with extensible architecture in mind:
Automating FortiManager (FMG) Devices
ZTP Provisioning
NetShot Integration
Design Mindset Emphasis: Reusability, abstraction, and validation checks.
Build new playbooks live based on requested scenarios:
Reinforce thinking: “How do I turn a manual task into an event-driven, validated, and auditable process?”
Connector Building (Advanced Integration Topics)

This chapter will help you begin exploring FortiSOAR. Continue on to he next chapters
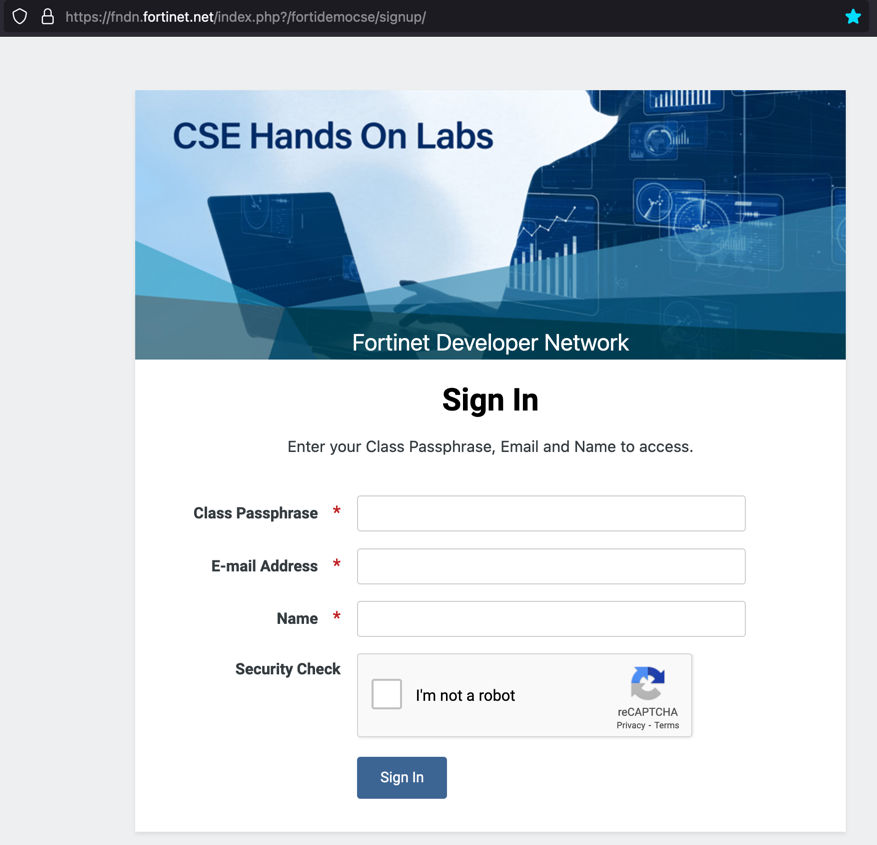
Navigate to the FNDN Lab Environment. Input the Passphrase provided by the instructor, your Email Address, and your Name. Complete the CAPTCHA and click Sign In to access the lab environment.
Locate FortiSOAR in the menu under Your Training Instance. Click the HTTPS button to launch the sign-in page to the FortiSOAR instance in your lab environment.
The ordering and names of your instance options may be different from the ones shown in the below screenshot.
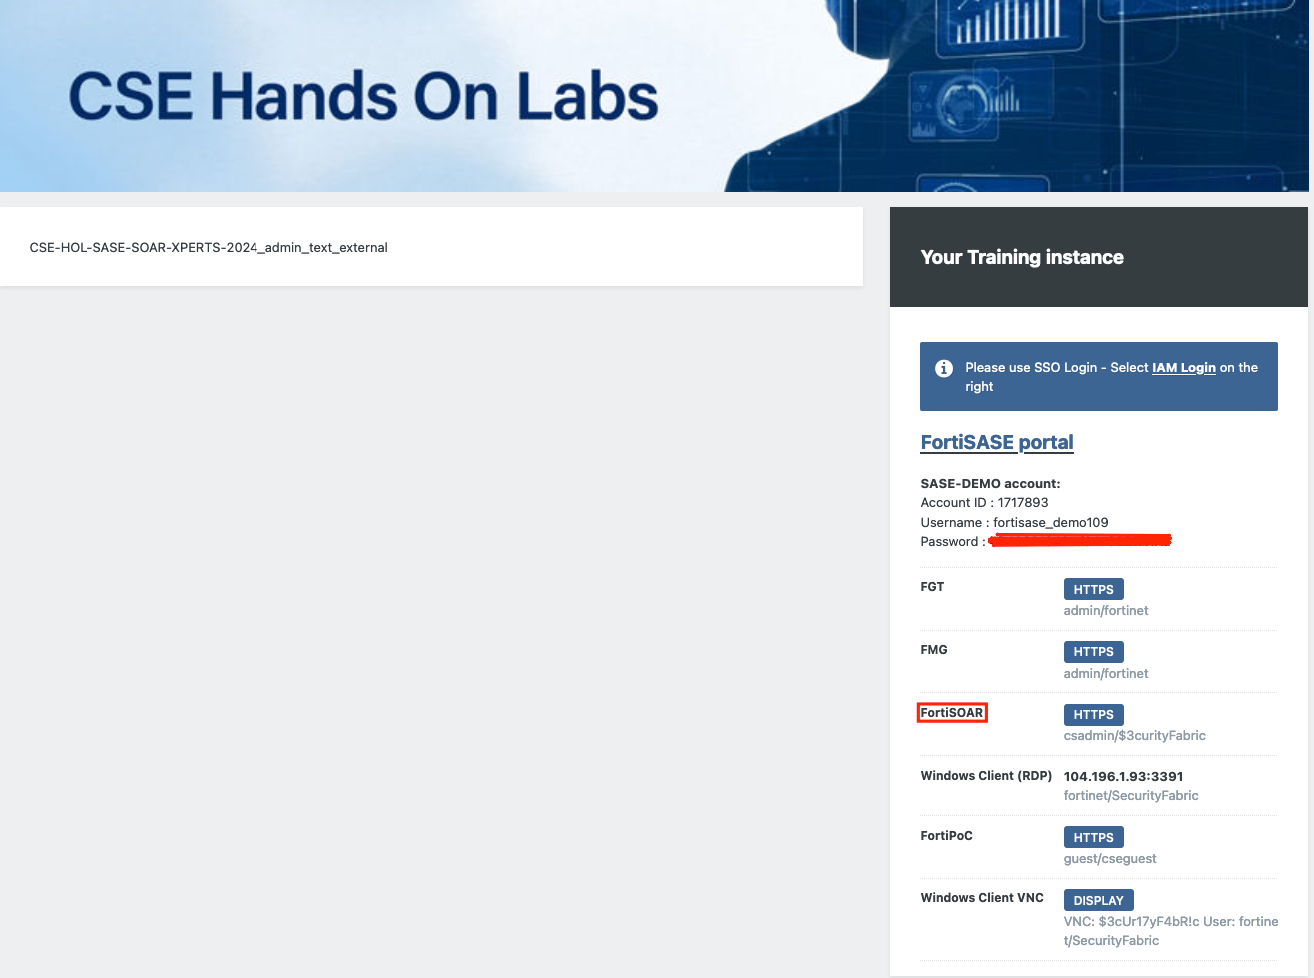
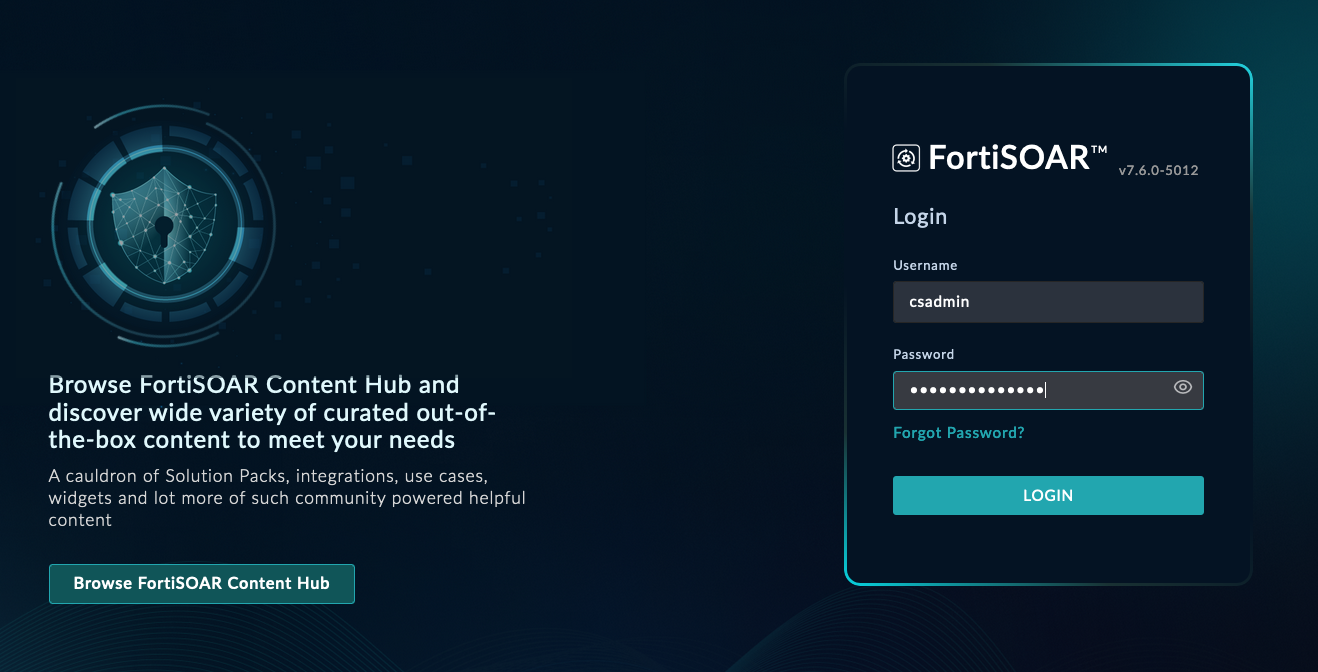
Login to FortiSOAR using the credentials below:
| Key | Value |
|---|---|
| Username | csadmin |
| Password | $3curityFabric |
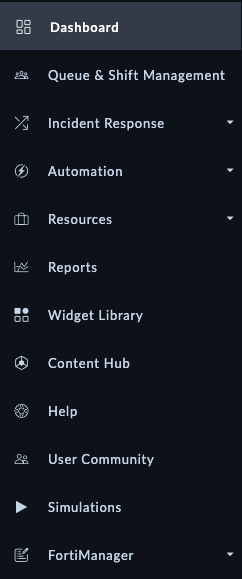
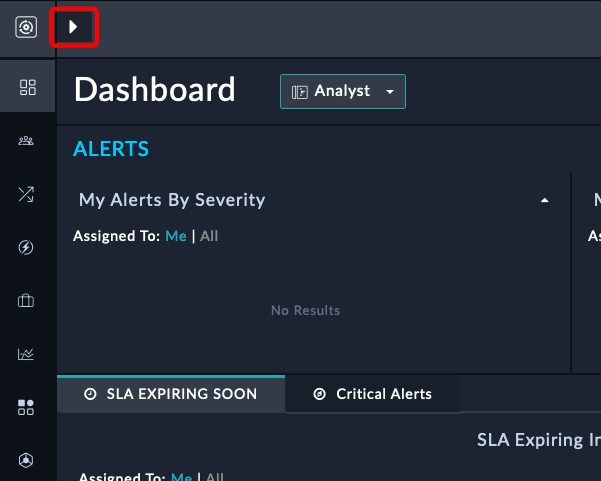
Expand the left hand navigation pane by clicking the arrow in the top-left corner of FortiSOAR.
This chapter aims to get you familiar with the FortiSOAR interface and key concepts. If you’re new to security orchestration and automation, this guide will help you understand the fundamental components and how they work together.
Before diving into FortiSOAR specifics, it’s helpful to understand what SOAR (Security Orchestration, Automation, and Response) is:
SOAR platforms like FortiSOAR help teams automate repetitive tasks, coordinate security tools, and manage incidents more efficiently. This results in faster response times, reduced analyst fatigue, and improved operations.
Below are the essential terms you’ll encounter when working with FortiSOAR:
| Term | Definition | Why It Matters |
|---|---|---|
| Dashboard | The first page you see when you log in to FortiSOAR. It provides an overview of the system and the modules you have access to. | Gives you a quick snapshot of your security posture and pending work. |
| Module | A table of data that is used to store information. ie. Incidents, Alerts, Indicators, Tasks, etc. | Organizes different types of security data for better management. FortiSOAR lets you customize this to extreme ends, and even build your own modules. |
| Record | A row in a module. ie. a singular incident, alert, indicator task, or playbook. | Represents a specific item that needs attention or tracking. |
| Scenario | A special record that is used to simulate an incident or alert. | Allows you to test playbooks and automation without requiring setup and using real data. |
| Playbook | A series of automated tasks that are executed in a specific order. | Automates repetitive security workflows to increase efficiency. |
| Content Hub | A repository of connectors and solution packs that can be installed to extend the functionality of FortiSOAR. | Allows you to expand capabilities without custom development. |
| Connector | A tool that allows FortiSOAR to communicate with other security systems. | Enables integration with your existing security stack. |
| Solution Pack | A collection of modules, playbooks, scenario Records, dashboards, and reports that are designed to solve a specific use case. | Provides ready-made automation for common security scenarios. |
| Execution History | A log of all the playbooks that have been executed in FortiSOAR. | Helps with troubleshooting and compliance documentation. |
| System Settings | The settings that control the behavior of FortiSOAR. | Allows customization of the platform to meet your organization’s needs. |
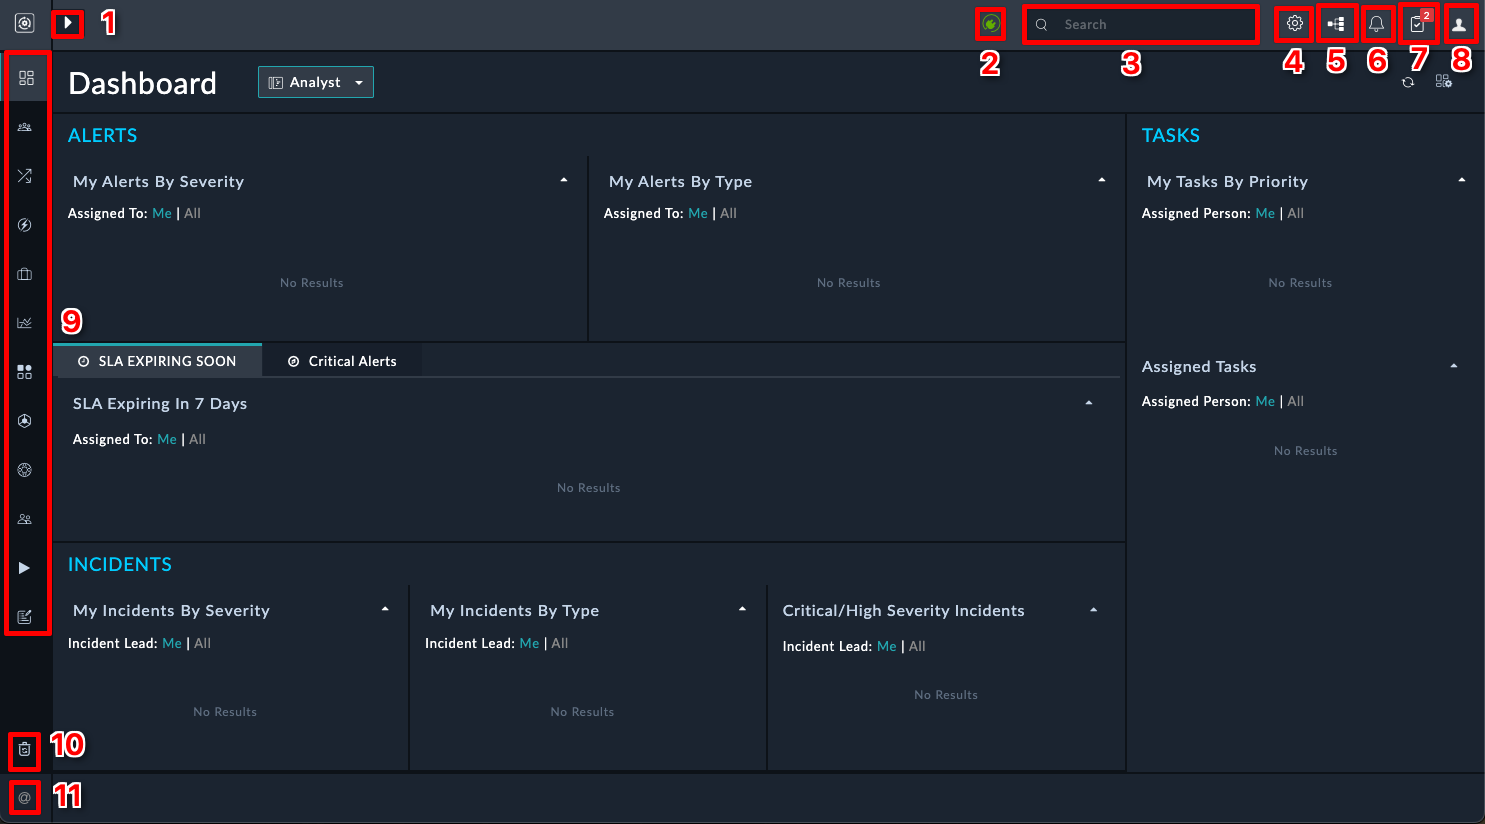
The interface is designed to give you easy access to all the functionality you need. Here are the key elements:
| Number | Picture | Name | Description | Common Uses |
|---|---|---|---|---|
| 1 | Navigation Expander | Used to expand the left hand navigation menu. | Toggle the navigation pane when you need more screen space. | |
| 2 | Live Sync Icon | Indicates that the information on the screen is updated in real-time. | Verify you’re seeing the latest data during active incidents. | |
| 3 | 
| Search Bar | Used as a global search for things in FortiSOAR. | Quickly find specific incidents, alerts, or indicators. |
| 4 | System Settings | Used to change the system settings of FortiSOAR. | Configure user permissions, email settings, and integrations. | |
| 5 | Execution History | A log of all the playbooks that have been executed in FortiSOAR. | Troubleshoot automation issues or verify actions were taken. | |
| 6 | 
| Notifications | Comment mentions or items that require your attention. | Stay informed about mentions and updates to your assigned items. |
| 7 | Pending Tasks | A list of tasks or playbook approvals that are assigned to you and require your attention. | Quickly access your to-do list and required approvals. | |
| 8 | User Profile | Used to change your user settings and log out of FortiSOAR. | Update your preferences and contact information. | |
| 9 | Expand Me
| Navigation Menu | The left hand navigation menu that contains all the modules and pages you have access to in FortiSOAR. | Access different modules and functionality of the platform. |
| 10 | Recycle Bin | A place where deleted records/playbooks are stored. You can restore deleted items from the recycle bin. | Recover accidentally deleted items. | |
| 11 | Version | The version of FortiSOAR you are currently using. | Verify your version when troubleshooting or updating. |
The most commonly used features when demoing are the Navigation Expander (where Content Hub, Alerts, Playbooks are found), Execution History, System Settings, and Scenarios. Familiarize yourself with these to navigate FortiSOAR efficiently.
Take 5-10 minutes clicking around FortiSOAR to get a feel for the interface. You can’t break anything, so don’t be afraid to explore. 😄
As a challenge, try to find the following items in the interface:
Only proceed to the next chapter when you feel comfortable navigating the FortiSOAR interface.
Think of a REST API like ordering langos over the phone. You call the langos place (API endpoint), tell them what you want (HTTP request), and they respond with your order status or the langos itself (HTTP response).
Key Concept: REST APIs use standard HTTP methods to perform operations

| Method | langos Action | What It Does | Network Equivalent |
|---|---|---|---|
| GET | “What langoss do you have?” | View the menu | Get device status, view policies |
| POST | “I’d like to order a large pepperoni” | Create new order | Add firewall rule, create VLAN |
| PUT | “Change my order to extra cheese” | Update existing order | Modify interface config |
| DELETE | “Cancel my order” | Remove the order | Delete policies, remove devices |
Base URL: https://tonys-langos.com/api/v1/
Example langos Endpoints:
GET    /menu                       # See what's available
GET    /orders/12345              # Check your specific order
POST   /orders                    # Place a new order
PUT    /orders/12345              # Change your order
DELETE /orders/12345              # Cancel your order
Example Network Endpoints:
GET    /devices                   # List all devices
GET    /devices/fw-01            # Get specific device info
POST   /devices                  # Add new device
PUT    /devices/fw-01/config     # Update device config
DELETE /devices/fw-01 # Remove deviceResponse codes are important to understand since they indicate either a success or problem that occurred with the request. The table below describes the most common response codes you will see when working with API’s
| Code | langos Meaning | Network Meaning | When You See It |
|---|---|---|---|
| 200 | “Your langos is ready!” | Success | Operation completed |
| 201 | “Order placed successfully!” | Created | New resource created |
| 400 | “We don’t have pineapple langos” | Bad Request | Invalid data sent |
| 401 | “You need to give us your phone number” | Unauthorized | Authentication failed |
| 404 | “That langos doesn’t exist” | Not Found | Resource doesn’t exist |
| 500 | “Our oven is broken” | Server Error | API/device internal error |
langos Order Request:
POST /api/v1/orders HTTP/1.1
Host: tonys-langos.com
Content-Type: application/json
Authorization: Bearer customer-loyalty-card-123

{
  "size": "large",
  "toppings": ["pepperoni", "mushrooms"],
  "crust": "thin",
  "delivery_address": "123 Main St"
}
langos Order Response:
HTTP/1.1 201 Created
Content-Type: application/json

{
  "order_id": 12345,
  "status": "preparing",
  "estimated_time": "25 minutes",
  "total": "$18.99"
}
Network Policy Request:
POST /api/v1/firewall/policies HTTP/1.1
Host: fortigate.company.com
Content-Type: application/json
Authorization: Bearer your-token-here

{
  "name": "Allow-Web-Traffic",
  "source": "LAN",
  "destination": "WAN",
  "service": "HTTP"
}{
"langos": {
"name": "Supreme Deluxe",
"size": "large",
"price": 22.99,
"toppings": [
{
"name": "pepperoni",
"extra": false
},
{
"name": "cheese",
"extra": true
}
]
}
}Network Device Format:
{
  "device": {
    "hostname": "fw-branch-01",
    "ip_address": "192.168.1.1",
    "model": "FortiGate-60F",
    "interfaces": [
      {
        "name": "port1",
        "ip": "192.168.100.1/24",
        "status": "up"
      }
    ]
  }
}# langos version
curl -X GET "https://tonys-langos.com/api/v1/menu" \
-H "Authorization: Bearer loyalty-card-123"
# Network version
curl -X GET "https://fortimanager.company.com/api/v2/devices/fw-01" \
-H "Authorization: Bearer your-api-key"# langos version
curl -X POST "https://tonys-langos.com/api/v1/orders" \
-H "Content-Type: application/json" \
-H "Authorization: Bearer loyalty-card-123" \
-d '{
"size": "large",
"toppings": ["pepperoni"],
"delivery": true
}'
# Network version
curl -X POST "https://fortigate.company.com/api/v2/policies" \
-H "Content-Type: application/json" \
-H "Authorization: Bearer your-api-key" \
-d '{
"name": "Block-Social-Media",
"action": "deny",
"source": "LAN-Users",
"service": "Facebook"
}'# langos version
curl -X PUT "https://tonys-langos.com/api/v1/orders/12345" \
-H "Content-Type: application/json" \
-d '{
"special_instructions": "Extra cheese please!",
"delivery_time": "ASAP"
}'
# Network version
curl -X PUT "https://switch.company.com/api/v1/interfaces/GigE0/1" \
-H "Content-Type: application/json" \
-d '{
"description": "Server Farm Connection",
"vlan": 100
}'langos Error Response:
{
  "error": {
    "code": 400,
    "message": "Sorry, we're out of pineapple",
    "suggestion": "Try pepperoni instead?"
  }
}
Network Error Response:
{
  "error": {
    "code": 400,
    "message": "Invalid VLAN ID",
    "details": "VLAN ID must be between 1-4094"
  }
}
Next we’ll look at how to use the API in FortiManager
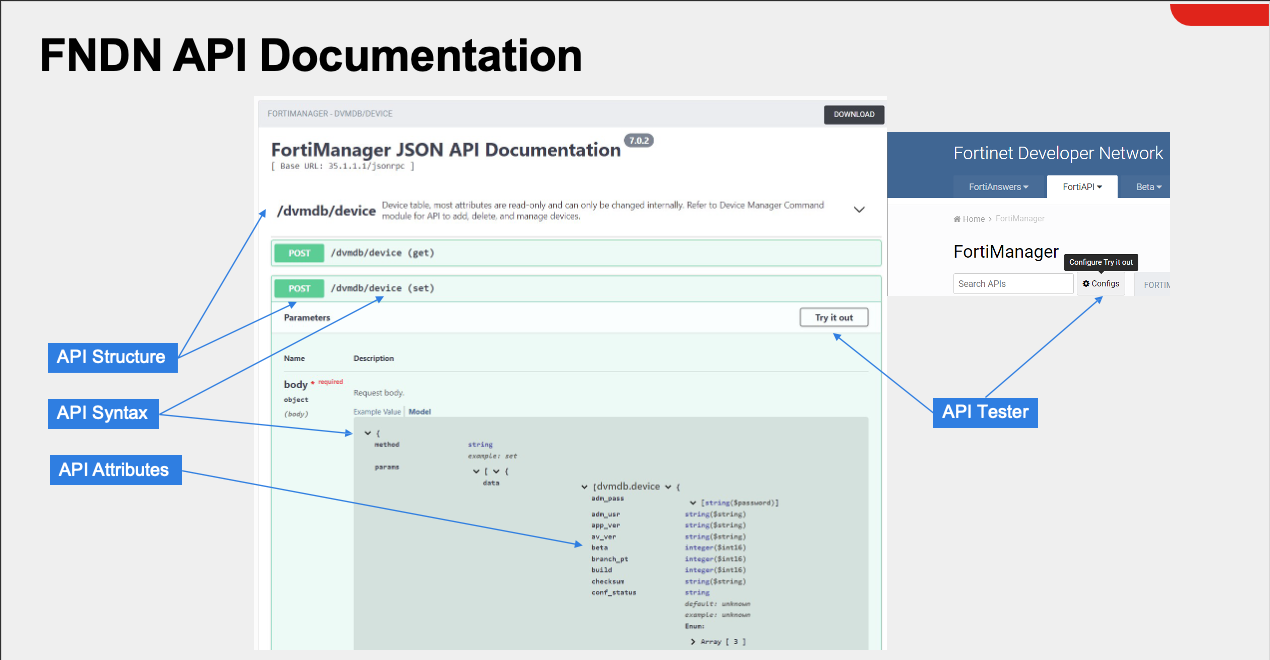
The FortiManager API provides programmatic access to all FortiManager functions, enabling you to automate device management, policy deployment, and configuration tasks. This guide will teach you how to discover API calls, understand their structure, and implement them in your automation workflows.
The easiest way to understand FortiManager APIs is to watch what happens when you use the web interface. Your browser’s Developer Tools can reveal the exact API calls behind every action.
Step-by-Step Process:
Login to FortiManager.

Open Developer Tools
Ctrl + Shift + I (Windows/Linux) or Cmd + Option + I (Mac)F12Prepare Network Monitoring
Execute the Action
Filter and Analyze
json in the filter box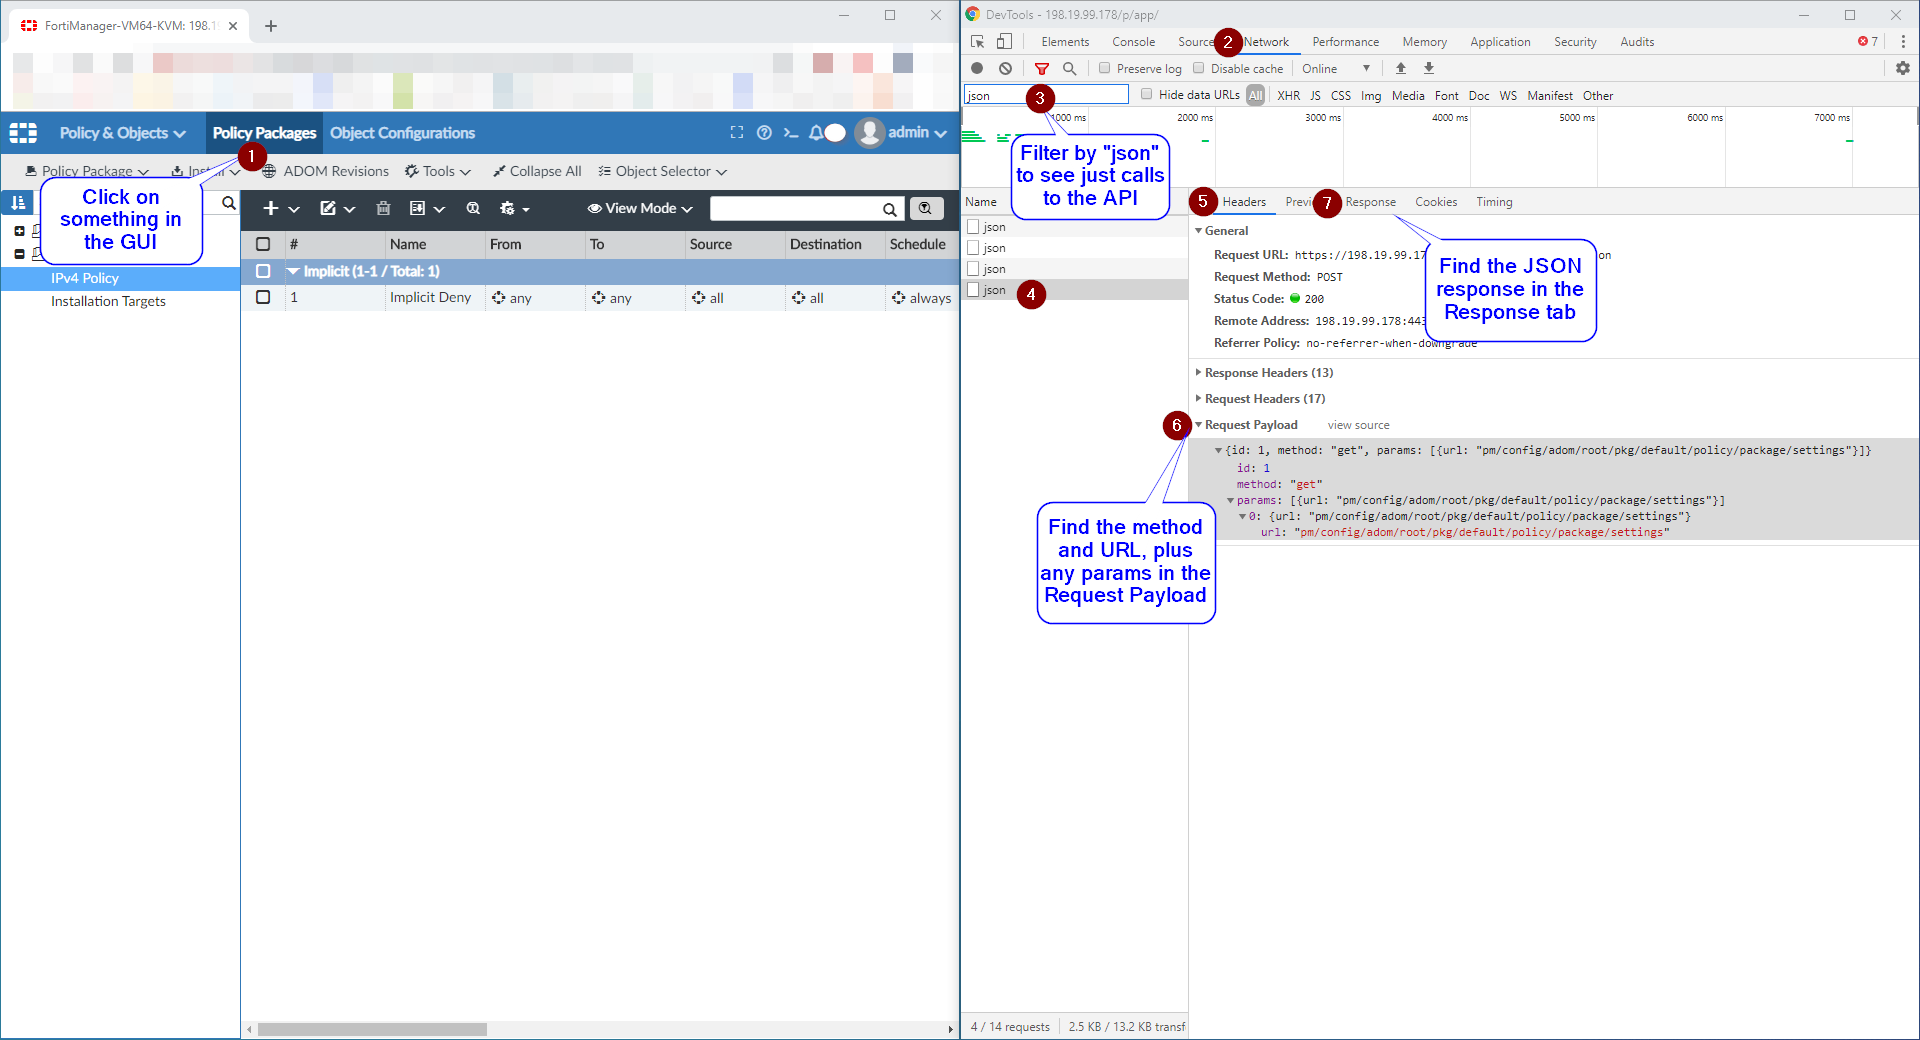
Request Headers Section:
Request URL: https://your-fmg.company.com/jsonrpc
Request Method: POST
Content-Type: application/json
Request Payload (Body):
{
  "method": "get",
  "params": [
    {
      "url": "/pm/config/adom/root/obj/firewall/policy",
      "option": [
        "get meta"
      ]
    }
  ],
  "session": "abc123session456",
  "id": 1
}
Response:
{
  "result": [
    {
      "status": {
        "code": 0,
        "message": "OK"
      },
      "url": "/pm/config/adom/root/obj/firewall/policy",
      "data": [
        ...
      ]
    }
  ],
  "id": 1
}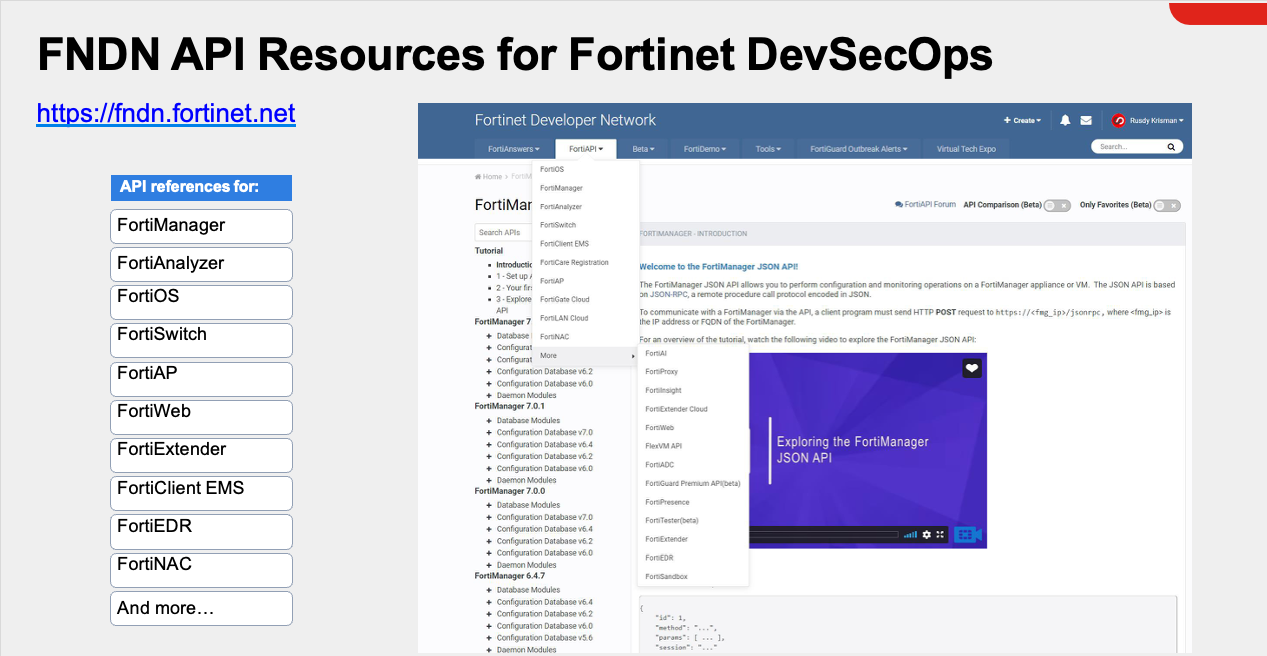
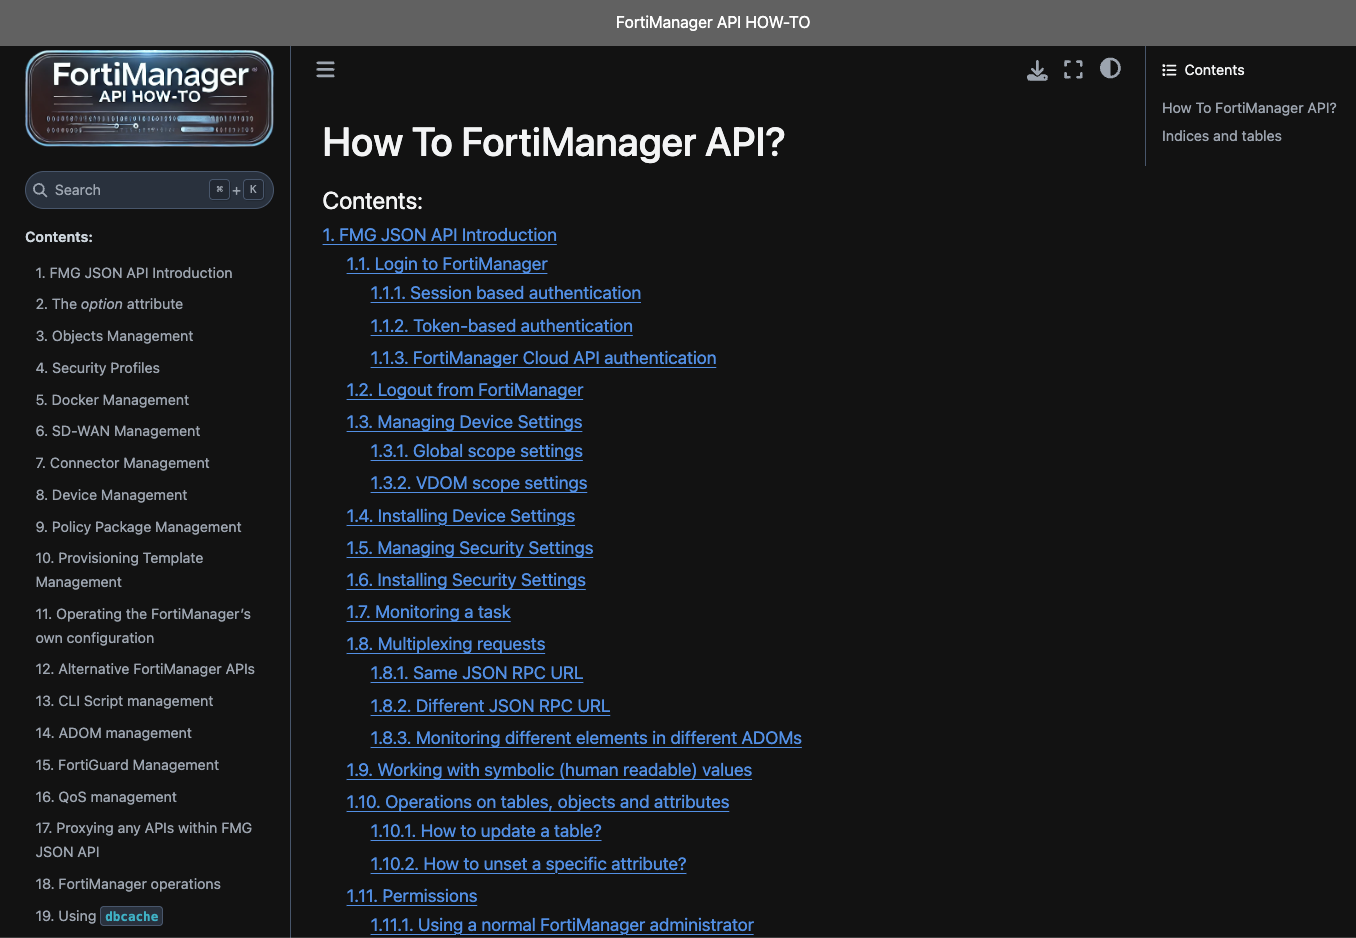
This is my favorite method by far. This is an example based API Doc that has examples of API calls with an easily searchable interface.
https://how-to-fortimanager-api.readthedocs.io/en/latest/index.html
FortiManager uses JSON-RPC 2.0 protocol for API communication. Every request follows this structure:
{
  "method": "operation_type",
  "params": [
    {
      "url": "/api/endpoint/path",
      "data": {
        object_data
      },
      "option": [
        "additional_options"
      ]
    }
  ],
  "session": "session_token",
  "id": request_id
}| Method | Purpose | Example Use |
|---|---|---|
get | Retrieve data | Get firewall policies, device status |
add | Create new objects | Add address objects, create policies |
set | Modify existing objects | Update policy settings, change device config |
delete | Remove objects | Delete policies, remove devices |
update | Bulk updates | Mass policy changes |
clone | Copy objects | Duplicate policies or objects |
move | Reorder items | Change policy sequence |
FortiManager API URLs follow predictable patterns:
Device Management:
/dvmdb/device/{device}/device - Device operationsPolicy & Objects:
/pm/config/adom/{adom}/obj/firewall/address - Address objects/pm/config/adom/{adom}/obj/firewall/policy - Firewall policies/pm/config/adom/{adom}/obj/firewall/service/custom - Service objectsSystem Operations:
/sys/status - System status/sys/login/user - User managementAll API responses follow this format:
{
  "result": [
    {
      "status": {
        "code": 0,
        "message": "OK"
      },
      "url": "/pm/config/adom/root/obj/firewall/address",
      "data": [
        {
          "name": "Test-Server",
          "uuid": "550e8400-e29b-41d4-a716-446655440000",
          "type": "ipmask",
          "subnet": [
            "192.168.100.50",
            "255.255.255.255"
          ]
        }
      ]
    }
  ],
  "id": 1
}
Status Codes:
0 - Success-2 - Object already exists-3 - Object does not exist-6 - Invalid url-10 - Data is invalid for selected url-11 - No permissionRequest:
{
  "method": "get",
  "params": [
    {
      "url": "/pm/config/adom/root/pkg/default/firewall/policy"
    }
  ],
  "session": "your-session",
  "id": 1
}Request:
{
  "method": "add",
  "params": [
    {
      "url": "/pm/config/adom/root/obj/firewall/address",
      "data": {
        "name": "WebServer-DMZ",
        "type": "ipmask",
        "subnet": [
          "10.0.100.10",
          "255.255.255.255"
        ],
        "comment": "DMZ Web Server"
      }
    }
  ],
  "session": "your-session",
  "id": 1
}Request:
{
  "method": "add",
  "params": [
    {
      "url": "/pm/config/adom/root/obj/firewall/address",
      "data": [
        {
          "name": "Server-01",
          "type": "ipmask",
          "subnet": [
            "192.168.10.10",
            "255.255.255.255"
          ]
        },
        {
          "name": "Server-02",
          "type": "ipmask",
          "subnet": [
            "192.168.10.11",
            "255.255.255.255"
          ]
        },
        {
          "name": "Server-03",
          "type": "ipmask",
          "subnet": [
            "192.168.10.12",
            "255.255.255.255"
          ]
        }
      ]
    }
  ],
  "session": "your-session",
  "id": 1
}After creating or modifying policies, install them to devices:
Request:
{
  "method": "exec",
  "params": [
    {
      "url": "/securityconsole/install/package",
      "data": {
        "adom": "root",
        "pkg": "default",
        "scope": [
          {
            "name": "FortiGate-01",
            "vdom": "root"
          },
          {
            "name": "FortiGate-02",
            "vdom": "root"
          }
        ]
      }
    }
  ],
  "session": "your-session",
  "id": 1
}FortiManager maintains established tunnels to FortiGate devices, allowing you to leverage these connections for API calls. This approach offers several advantages:
To execute API calls through FortiManager, you need to specify the FortiOS API endpoint within the FortiManager request structure.
| Parameter | Description |
|---|---|
| target | Device or group identifier (e.g., All_FortiGate group) |
| action | HTTP method (get, post, put, delete) |
| resource | FortiOS API endpoint path |
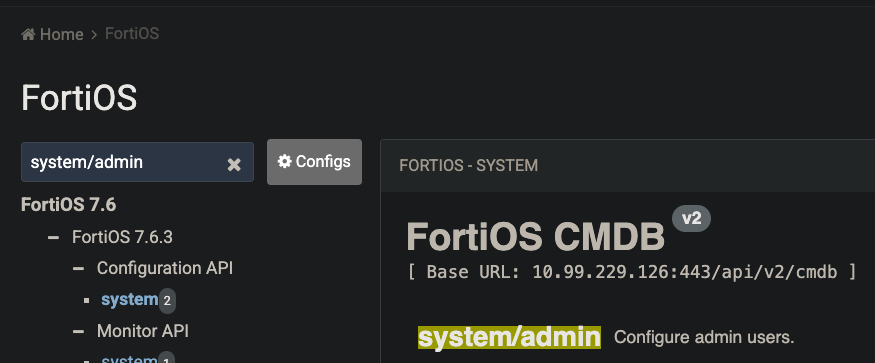
This example demonstrates querying admin users from all FortiGates in the ADOM using the hidden All_FortiGate group:
{
  "id": "1",
  "method": "exec",
  "params": [
    {
      "url": "/sys/proxy/json",
      "data": {
        "target": "adom/root/group/All_FortiGate",
        "action": "get",
        "resource": "/api/v2/cmdb/system/admin?format=name"
      }
    }
  ],
  "verbose": 1,
  "session": "{{session}}"
}
This is what the api looked like in FNDN for querying fortigate admin users (/api/v2/cmdb + /system/admin)
Make sure to check out all the options available with /sys/proxy/json here
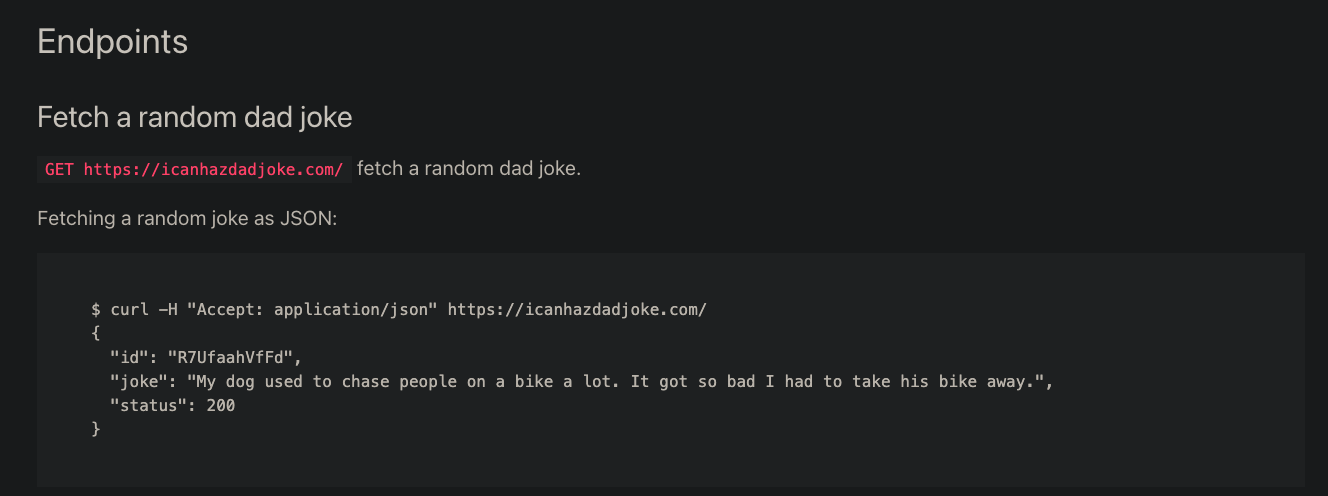
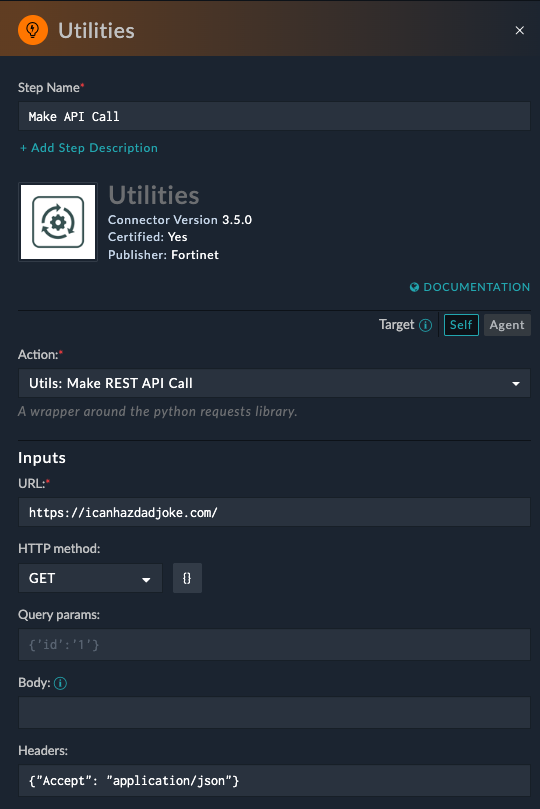
This guide demonstrates how to make generic API calls directly within SOAR playbooks when specific connectors aren’t available. We’ll use the Dad Joke API as a practical example.
Base URL: https://icanhazdadjoke.com/
Key Features:
API Response Formats:
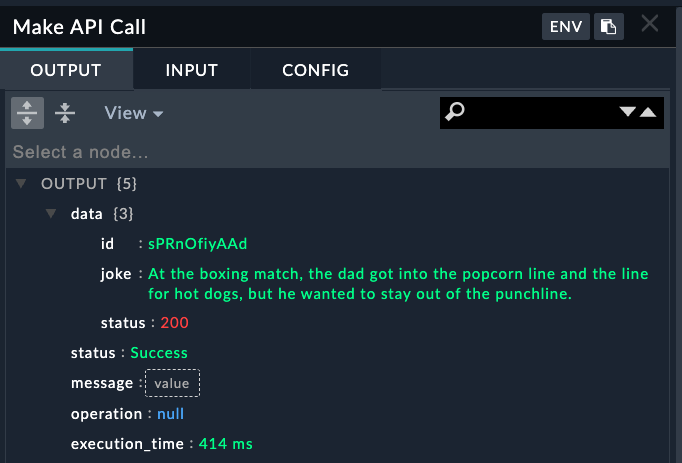
application/json - JSON responseExample JSON Response:
{
  "id": "R7UfaahVfFd",
  "joke": "My dog used to chase people on a bike a lot. It got so bad I had to take his bike away.",
  "status": 200
}
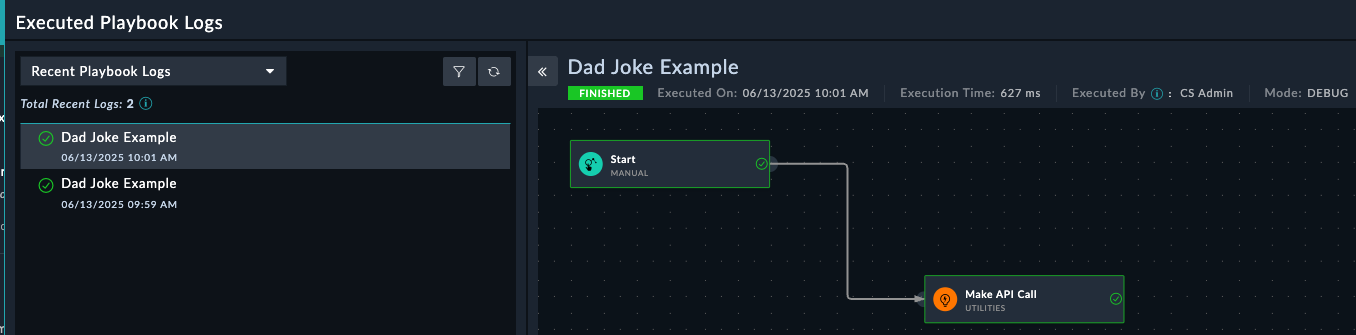
You should now see this screen:
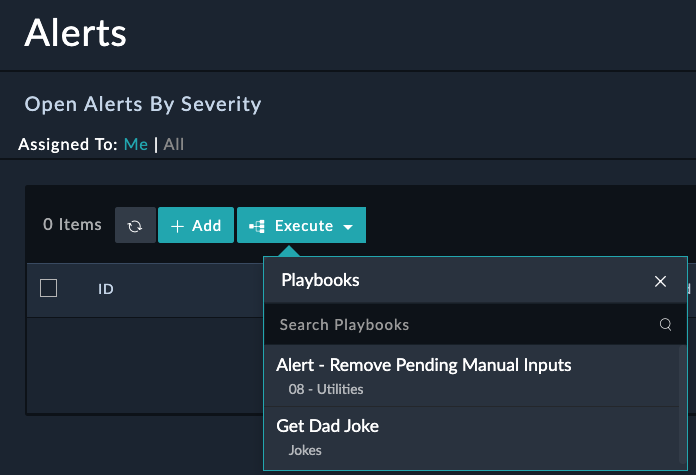
Get Dad JokeYesAlerts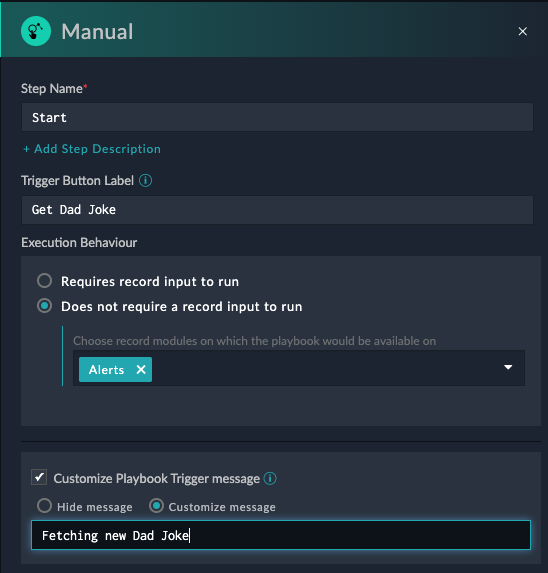
Make API Callhttps://icanhazdadjoke.com/GET{"Accept": "application/json"}Your step should look like this:

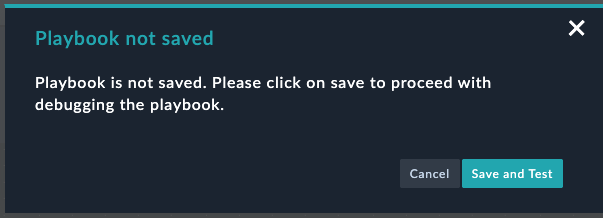

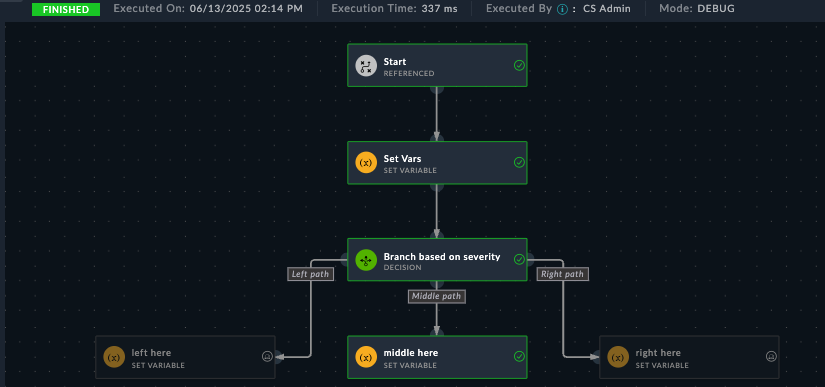
The execution history will display automatically, showing real-time playbook execution with input/output details for each step.
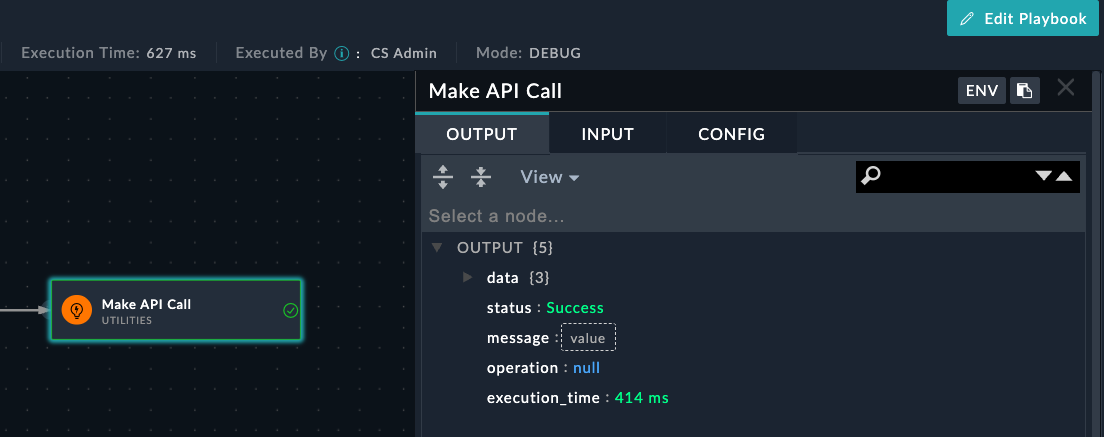
Having SOAR make API calls internally is fun and all, but what if you wanted to display the joke with a pop-up, or add the joke to an Alert? Or what if we wanted to schedule this playbook to run twice a day? These concepts and more will be covered in the Playbooks section.
The FortiManager JSON RPC connector was created by myself (Dylan Spille) to better work with the RPC actions that FortiManager supports. In order to use this connector, you do need to have familiarity with FMG API endpoints, and how to format the request data. Make sure you’ve read the FMG API section before this chapter.
The Venn diagram between playbooks, jinja, and API in SOAR is very much like a complete circle, so it’s a little challenging to have different chapters but not involve the other sections. If you find yourself stuck, you may want to visit the Playbooks chapter and come back to this later.
admin$3curityFabric
config system admin user
    edit "fortisoar"
        set password fortinet
        set profileid "Super_User"
        set avatar "/9j/4AAQSkZJRgABAQAAAQABAAD/2wBDAAMCAgMCAgMDAwMEAwMEBQgFBQQEBQoHBwYIDAoMDAsKCwsNDhIQDQ4RDgsLEBYQERMUFRUVDA8XGBYUGBIUFRT/2wBDAQMEBAUEBQkFBQkUDQsNFBQUFBQUFBQUFBQUFBQUFBQUFBQUFBQUFBQUFBQUFBQUFBQUFBQUFBQUFBQUFBQUFBT/wAARCABAAEADAREAAhEBAxEB/8QAHwAAAQUBAQEBAQEAAAAAAAAAAAECAwQFBgcICQoL/8QAtRAAAgEDAwIEAwUFBAQAAAF9AQIDAAQRBRIhMUEGE1FhByJxFDKBkaEII0KxwRVS0fAkM2JyggkKFhcYGRolJicoKSo0NTY3ODk6Q0RFRkdISUpTVFVWV1hZWmNkZWZnaGlqc3R1dnd4eXqDhIWGh4iJipKTlJWWl5iZmqKjpKWmp6ipqrKztLW2t7i5usLDxMXGx8jJytLT1NXW19jZ2uHi4+Tl5ufo6erx8vP09fb3+Pn6/8QAHwEAAwEBAQEBAQEBAQAAAAAAAAECAwQFBgcICQoL/8QAtREAAgECBAQDBAcFBAQAAQJ3AAECAxEEBSExBhJBUQdhcRMiMoEIFEKRobHBCSMzUvAVYnLRChYkNOEl8RcYGRomJygpKjU2Nzg5OkNERUZHSElKU1RVVldYWVpjZGVmZ2hpanN0dXZ3eHl6goOEhYaHiImKkpOUlZaXmJmaoqOkpaanqKmqsrO0tba3uLm6wsPExcbHyMnK0tPU1dbX2Nna4uPk5ebn6Onq8vP09fb3+Pn6/9oADAMBAAIRAxEAPwD89dO0661e/t7Kyt5Lu8uHEUUEKlnkYnAUAdSTXtHlH01afsBeKNN0+1m8Z+NfBvgG8uUEi6breqot0qkZG5Bkisfarormvs31diT/AIYZs/8AouHw3/8ABp/9al7X+6w9n5oP+GGbP/ouHw3/APBp/wDWo9r/AHWHs/NB/wAMM2f/AEXD4b/+DT/61Htf7rD2fmg/4YZs/wDouHw3/wDBp/8AWo9r/dYez80JJ+wB4k1i2uP+EO8eeCfHGowoZP7M0nVkNzIAMnYjYJo9slurB7N9GfM2s6NfeHdVu9M1O0lsdQtJGhntp0KvG4OCCDW6d9UZbH0Z/wAE9dOtZfj/AC6zcwJcyeHtCv8AWLZJBkedGgCH8C+fwrGt8NjWl8Vz598W+LNV8ceI9Q13WryW/wBTv5mnnnmcszMxyevb2rZJJWRk3fVmRTA634W/DLWfi7420zwtoSI2pai5igMuRHv2kgMwBxnGM1MpKKuxpOTsjG8T+GNV8Ga/faJrdjNpuq2MrQ3FrOu143HUEU001dCatozLpgaGga9qHhfWbPVdLu5rHULOVZoLiByjo6nIII9xSavow2PpH9v+KLU/iN4O8WeRHBf+KPCthql95S7Q9wybXfA9SuaxpaJrsa1N0w/4J7f8lY8Y/wDYmap/KOit8K9Qpbs+Xq3Mj7H/AGRf2OdB8X+DLv4ufF3UToHw108s0UTt5bX5U4J3ddmRt45Y8CuapUafLHc2hBNc0tj2fwd/wUd+GfgPx7pHhz4e/DKz0DwRHKYp9SFsTezoFOPLjQbtzHAG4sTnnFZOjJq8nqaKqk7JaHz34g/ac8MfFb9rqHx38V/CG/wlDvtG0WGACVYtjLG0w4MjKWDHvxgdBWypuMOWL1MnNSneSOk/a1/Y48OaH4FtvjB8GtQ/tz4c3gD3NqjmR7AscZB67MnBDcqevsqdRt8s9ypwVuaOx8Y10mB9Sft1/wCu+Dn/AGIun/8As1YUuvqbVOnoM/4J7f8AJWPGP/Ymap/KOit8K9RUt2fPPgjw4/jDxloWhIxVtSvoLPcOq+Y4XP4ZzWrdlczSu7H3F/wVB8bTeHdT8CfBPw9m10DQ9Lgmks7bhZZTlIlIHXCrnHq+a5qCvebN6ztaKPdP2f8A9n74S/s8fAHwh8Vfip4R/wCEa8WaGGubi7vpJHmEzSERnylbazEbdqkEqfTrWU5ynJxi9DSMYxipSRo/GH4I/Br9qH4I+Nvip8OvCg8UeLNWtD9muLSWSGf7TGQB+6Y7UcY5G3LDrnNKMpwkoyeg5RjOLlE+c/8AgmD44mufGfjD4KeJ4nufDviHT5/M065ziKZBtkAB+6WUkHHdQe1bV1opoyovVxZ8WfEfwq3gX4g+JfDjtvfSdRuLEt6+XIyf0rpi7pMwas7H0D+3X/rvg5/2Iun/APs1ZUuvqa1OnoM/4J7f8lY8Y/8AYmap/KOit8K9RUt2fOXhe51K08SaXNo0skGrpdRm0liOHWbcNhHvnFbPbUyXkfWv7WH7IXxP+GttH8SvGvxH03xJcOsRW61O9db13CgrFGkmS5X0BwAK56dSMvdSNpwkvebPr74Q/Fb4c/tf/s4eF/h38U/HFhrHjPXwyzWltKLe9WeNyyHaBgOABg4w3YGueUZU5OUVobxcZxtJ6l3x34++F37GP7P/AIy+Hvw78b2Gi+NNHtWngtr6UT3j3UhBB2kYZjkcAYUckYFJKVSSlJaDbjTi0mfN/wDwTe+C3jCH44j4q+KLKa08OHRrjVE1qXH2e5MvBw44DL8xZeCMcgVtWkuXlRlSi+bmZ8V/GHxPB41+LHjLxBbArbaprF3eRg9lkmZh+hrqirRSOeTu2z3T9uv/AF3wc/7EXT//AGasqXX1NanT0Gf8E9v+SseMf+xM1T+UdFb4V6ipbs+cvDHiG68JeItN1qyETXun3CXMHnJvQSIcqSO+CAa2aurGSdnc+/vgN+1P4T/an+Ht98IP2gdRVdRupnm0nxNPtj2ysSVUt0R1LELngj5T2rknTdN88DpjNTXLM80+IX/BNf40/DLX4tT8ChPF+nxSCay1fQ7xILiPByrbWZWDe6Fh71arQkrSJdKS2IfB3/BN/wCO3xS1m61TxhHH4YikzLcat4jv1mmkbHdVZnJ6ctge9DrQjohKlN7l74eft0a/+zX8H9U+DU/hbTPElzYXl5ZveXd2ZbUwOSGjCp94ZLnO7BDCk6SnLnuNVHBctj491nUU1bVbu9jtILBJ5GkW1tVIiiBP3VBJOB9a6UYH0v8At1/674Of9iLp/wD7NWNLr6m1Tp6Gb/wT/wBd0/Tf2gV0rUbpLKLxFo97okc8hCqssyDywSemWQD8aKy926FTfvHifxF+HWv/AAs8W6h4d8R6dcabqNnK0TJPGVDgHAdSeqnqCK1jJSV0ZtOLszmaoR6b4F/aY+Kfw1tFtPDnjvW9Ms14FtHdsYx9FOQKzcIy3RSlJbMd43/ad+K3xGtGtPEPj3XNRtGGGt3u2WMj3UYFChFbIHOT3Z5j1rQk3PBXgjW/iH4kstC8Pabc6pqd3IsccFtGXPJxk46AdyeBUtqKuxpN6I+gP2/NQs7f4n+GfCVrdRXs/hHw3Y6LeSwncv2hEzIoPfBOKypbN9zSpvbsfMsE8ltMksTtFKjBldDgqR0INbmR9HeHf+CgPxb0bSLbTtQu9H8VQ2yhIZPEGmJcyqoGAN/DHHuTWDox6GqqSNP/AIeJfEX/AKFrwN/4IR/8XR7GPdh7Rh/w8S+Iv/QteBv/AAQj/wCLo9jHuw9ow/4eJfEX/oWvA3/ghH/xdHsY92HtGH/DxL4i/wDQteBv/BCP/i6PYx7sPaMo61/wUI+LmoabcWelz6J4VFwpSSfQdKjt5iD1w53EfUYNHsY9Q9pI+b7y8n1C7murqZ7i5mcySSysWZ2JySSepNbGR//Z"
        set rpc-permit read-write
    next
endconfig system global
set fgfm-allow-vm enable
endIf you do not allow vm’s, you will get a certificate error when trying to register fortigates to fortimanager
FortiManager JSON RPCFortiManager10.100.88.10fortisoarfortinet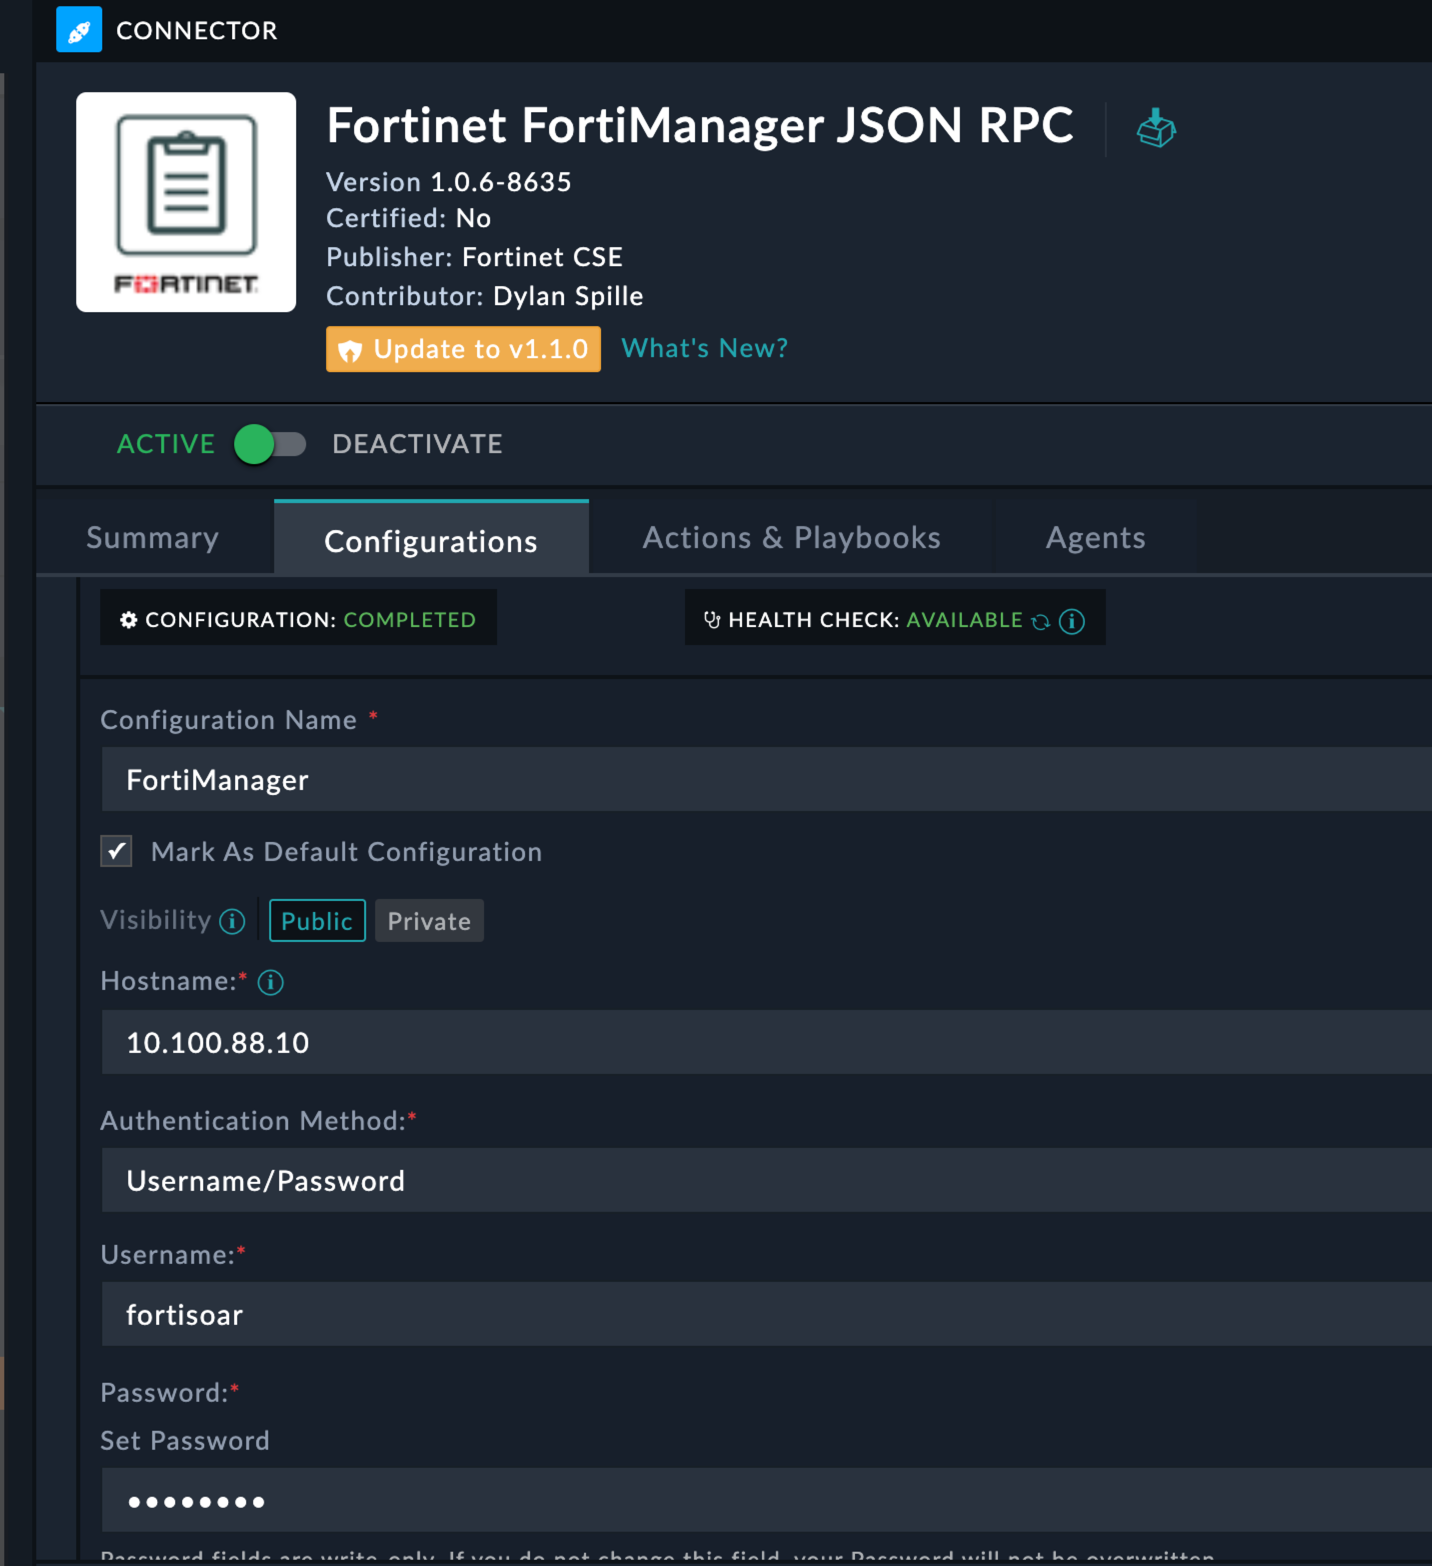
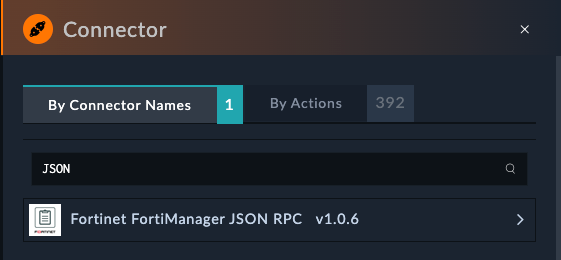
00 - FMG APIGet FMG DevicesJSON RPC and select the Fortimanager Connector
Get Devices
Action : JSON RPC Get/dvmdb/device{
"fields": [
"name",
"sn",
"extra info",
"os_ver",
"mr",
"patch",
"mgmt_mode"
],
"option": [
"extra info"
],
"loadsub": 0
}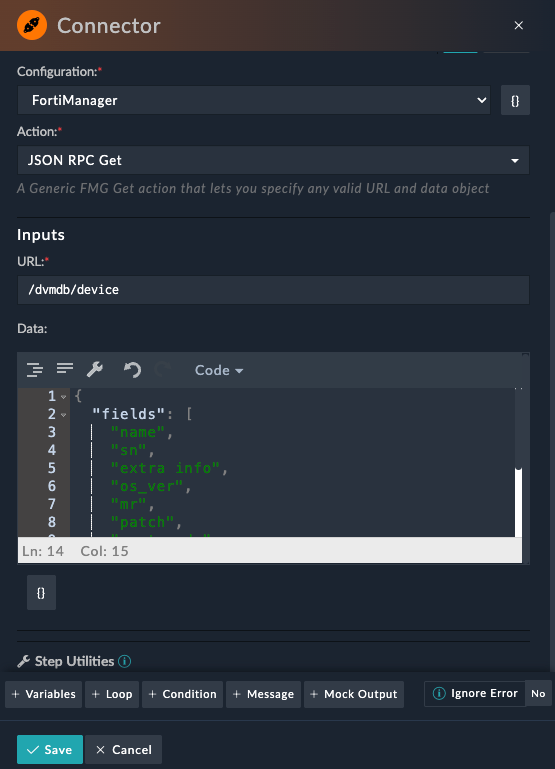

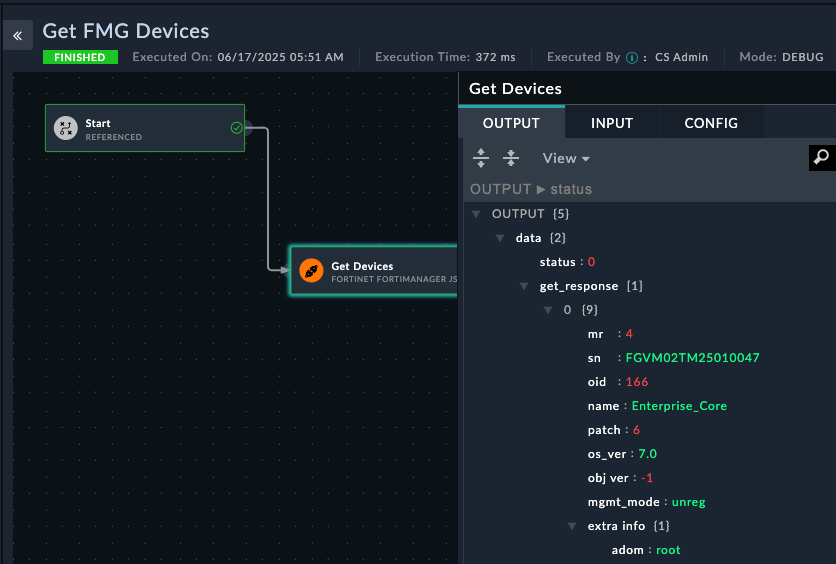
Important things to see in the API Output are the name, sn, and mgmt_mode values. mgmt_mode is unreg because we have not authorized the device yet
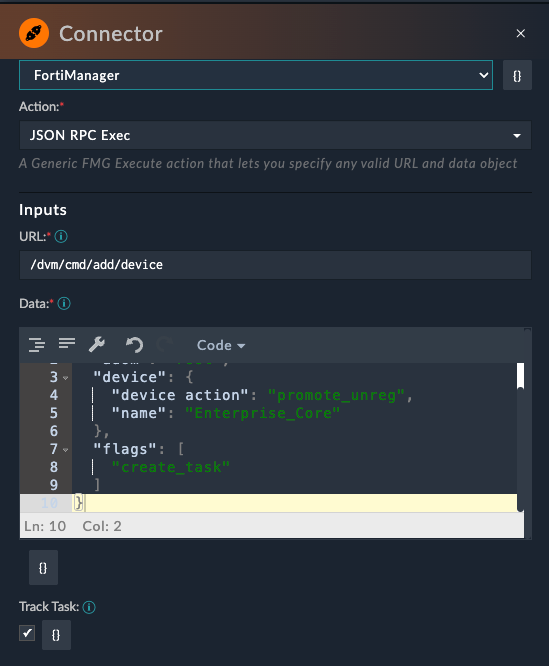
Now that we can see unregistered devices, let’s create a playbook to authorize them to FortiManager.
Create a new playbook called Authorize FMG Device
Add a JSON RPC connector step:
Authorize Device/dvm/cmd/add/device{
"adom": "root",
"device": {
"device action": "promote_unreg",
"name": "Enterprise_Core"
},
"flags": [
"create_task"
]
}Your step should look like this
Save the Playbook
Run/Trigger the playbook
If you switch to the FMG soon enough, you will see the add device task running
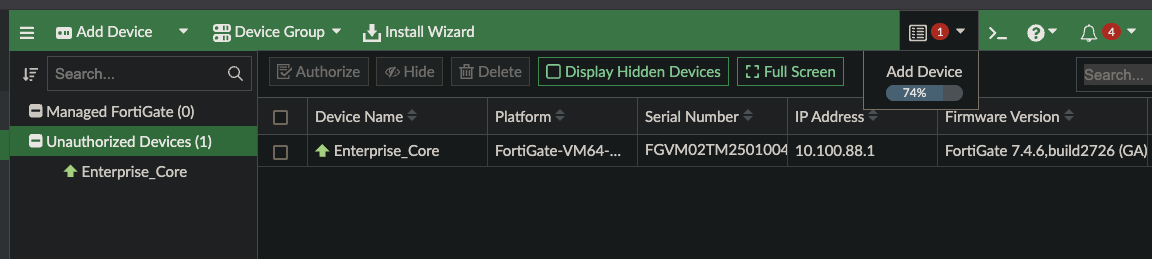
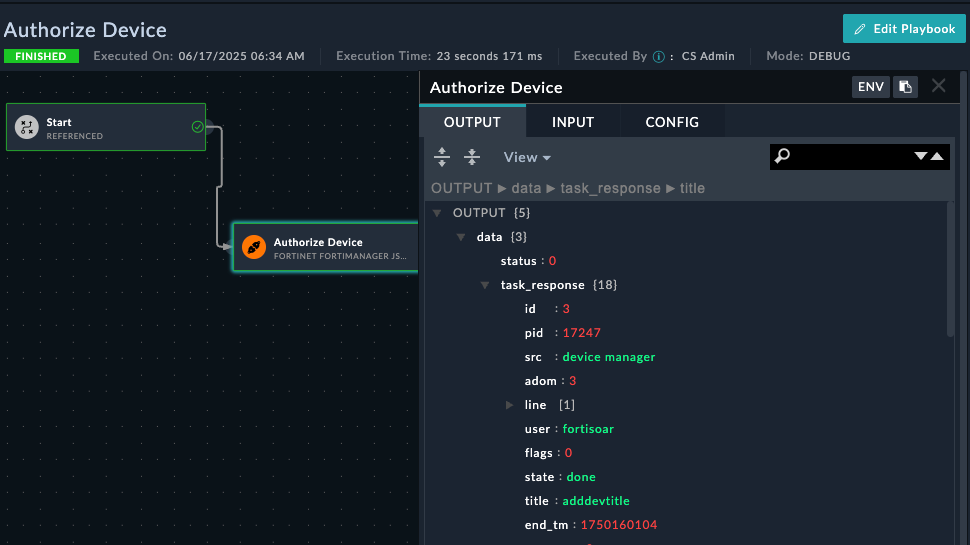
If successfully added, you will see this json output in SOAR
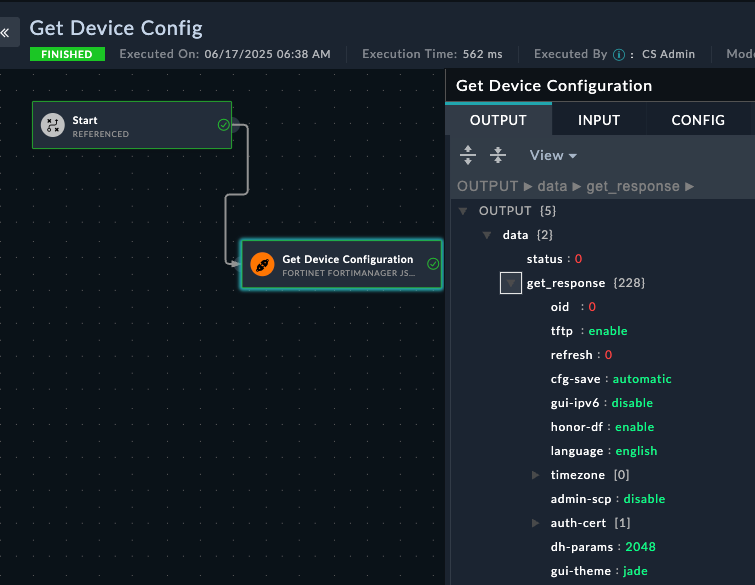
Create a new playbook called Get Device Config
Add JSON RPC connector step:
Get Device Configuration/pm/config/device/Enterprise_Core/vdom/root/system/global{
"option": ["get meta"]
}Save/Trigger the playbook. Your step output should look like this
Additional cases will be added depending on time, such as:
This section will provide an overview of playbooks and how they are used in FortiSOAR.
A playbook is a set of steps that can be executed in response to a trigger or alert. Playbooks can be used to automate repetitive tasks, such as gathering information, enriching data, and executing remediation actions. Playbooks can be created using the FortiSOAR Playbook Editor, which provides a visual interface for designing and configuring playbooks.
Playbooks can embody best practices and guide users through the process of responding to a security incident. This means that the users of playbooks don’t need to be experts in the tools and processes that are used to respond to an incident. More advanced users can create playbooks and expose them to less experienced users, who can then execute the playbooks to respond to incidents.
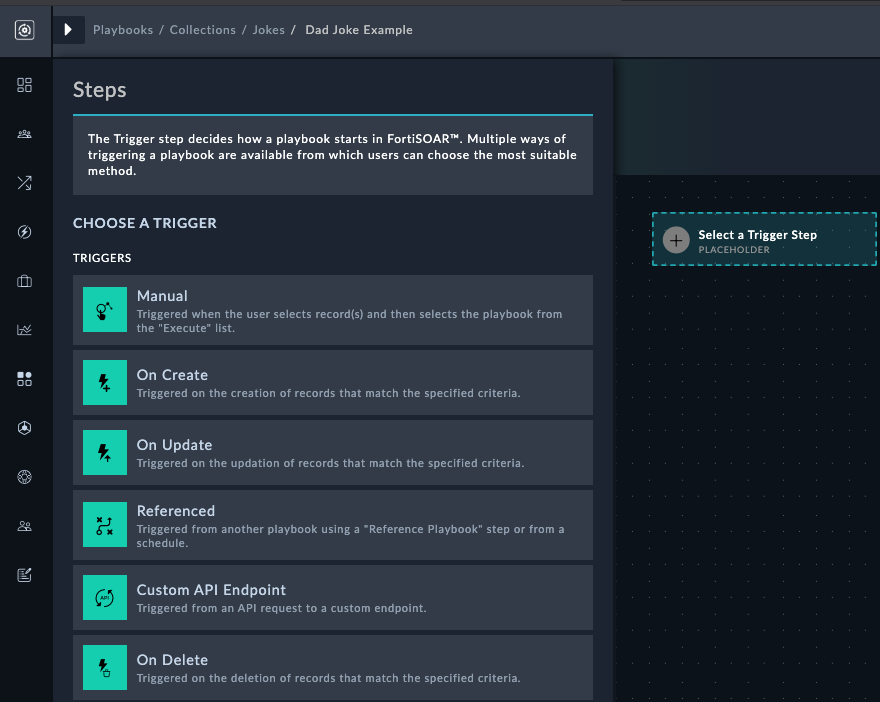
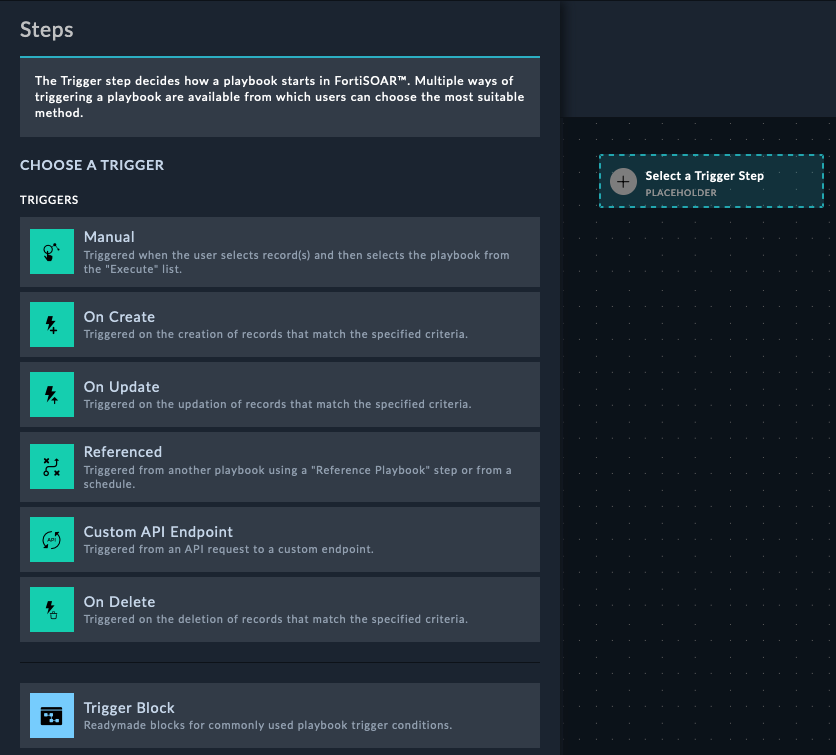
Playbooks can be triggered by a variety of events, such as a new incident being created, the severity of an alert changing, or even via webhook from an external tool. These events are called triggers.
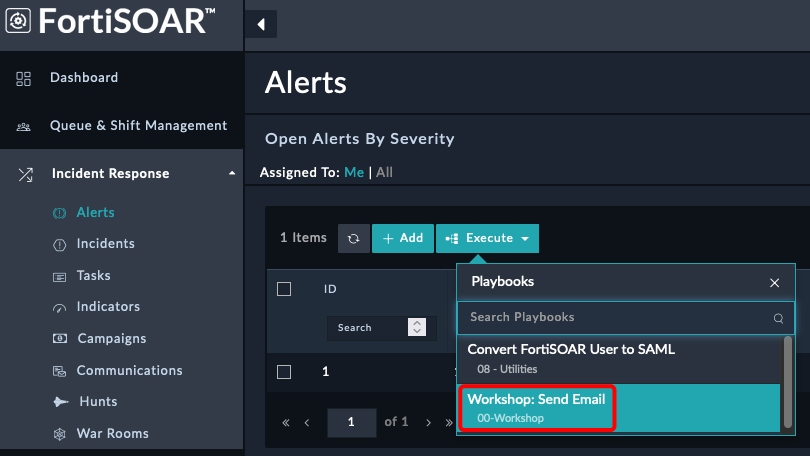
A manual trigger playbooks means that you want the playbook to only be started manually by a user. These playbooks will be accessible by clicking a button in the FortiSOAR UI on some record.
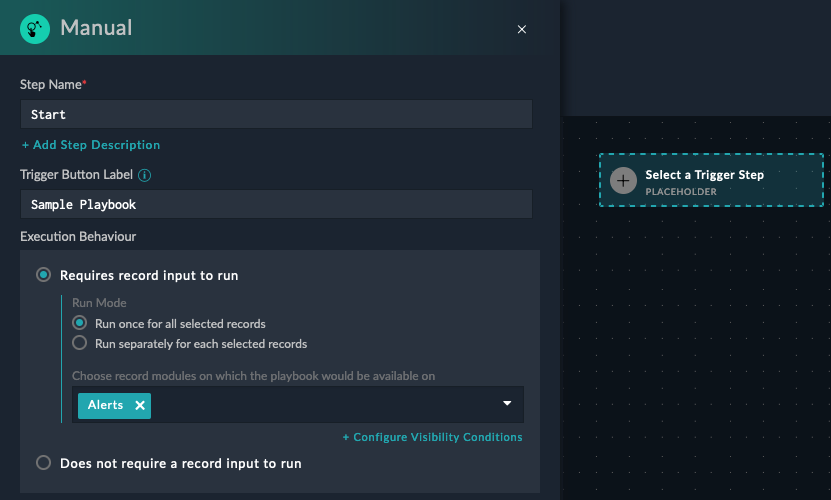
Notice from the image the Trigger Button Label and the selection of Alerts module. This means that the manual trigger will only be available on the Alerts module.
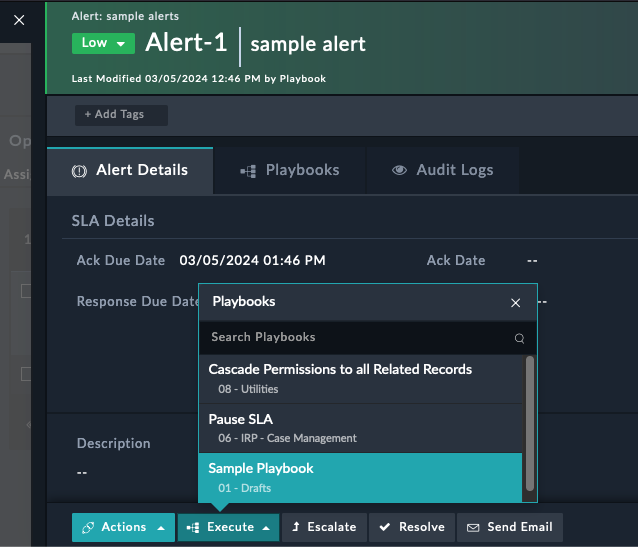
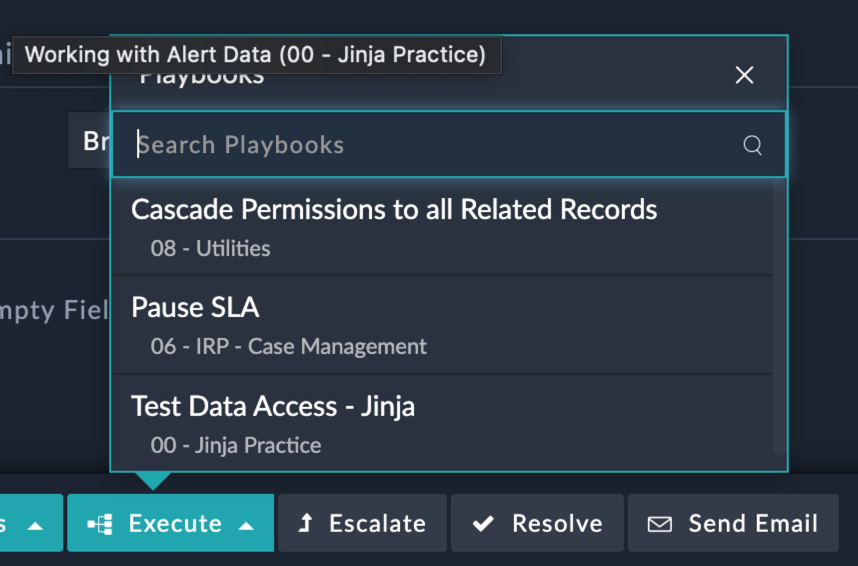
After creating a manual playbook and telling FortiSOAR what module to display it in, you can run the playbook by clicking the Execute button and selecting the playbook you want to run
You can have any number of manual triggers on any module, and you can also have multiple manual triggers on the same module.
An on-create trigger playbook means that the playbook will be started automatically when a new record is created in the module you specify. This is useful for creating a playbook that will run when a new incident is created, for example. You can also specify a filter to only run the playbook when certain conditions are met. For example, a playbook that filter for incidents with a severity of “High”, and the name of the incident contains “Ransomware”.
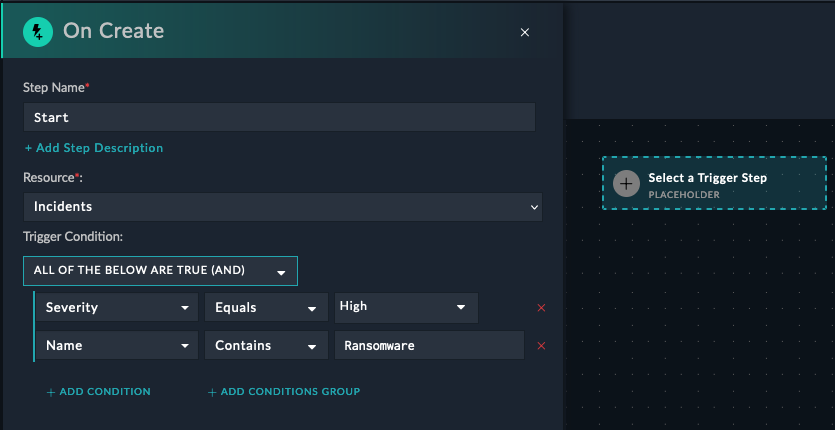
There is no limit to the number of on-create triggers you can have on a module
Typically, organizations will have different playbooks that run for different types of incidents.
An on-update trigger playbook means that the playbook will be started automatically when a record in the module you specify is updated/changed. This is useful for creating a playbook that will run when the severity of an incident changes, for example. You can also specify a filter to only run the playbook when certain conditions are met. For example, a playbook could trigger when the status of an incident changes to “In Progress”, so that FortiSOAR could automatically update the MTTA (Mean Time to Acknowledge) field in the incident record.
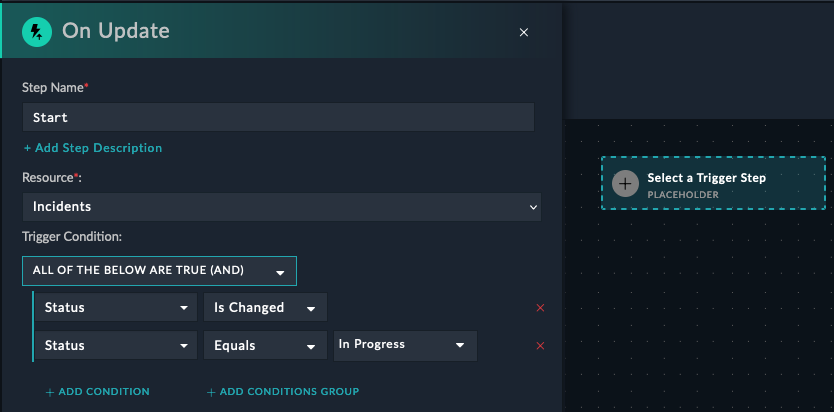
This trigger will only run when the status has changed AND changed to “In Progress”.
A reference trigger is used to signify that you want this playbook to be activated from another playbook. This is used to abstract out common functionality into a separate playbook, and then call that playbook from other playbooks. This is useful for creating a playbook that will run when a new incident is created, for example.
A custom API trigger allows you to create an API endpoint to enable external systems to trigger playbooks. Tools like Servicenow or Jira can be configured to call this API endpoint when certain events occur, and then FortiSOAR will run the playbook you specify.
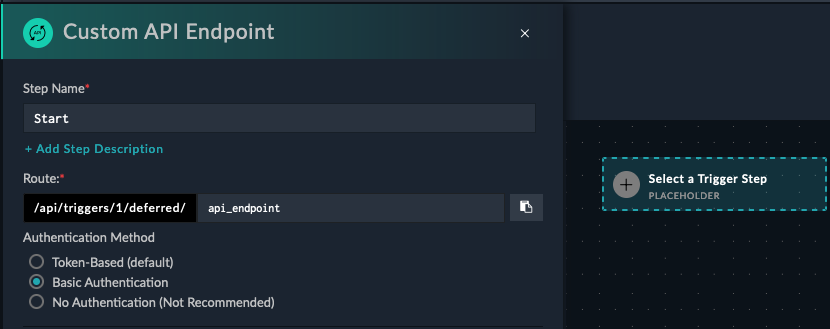
curl -X POST -u 'username:password' https://<FortiSOAR>/api/triggers/1/deferred/api_endpointimport requests
requests.post('https://<FortiSOAR>/api/triggers/1/deferred/api_endpoint', auth=('username', 'password') )Actions are the building blocks of playbooks. They are the individual steps that connect together after the trigger to form a playbook. There are many different types of actions, and they can be used to perform a wide variety of tasks such as but not limited to, sending an email, creating a ticket in a ticketing system, creating and updating FortiSOAR records, or even running a script on a remote server.
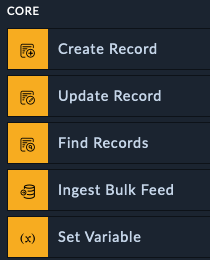
Core actions are used to do things like creating, updating, and searching for records in SOAR. You can also create variables and use them in other actions within the same playbook
The Create Record action lets you add new entries to any module in SOAR, such as alerts, incidents, or assets. This is commonly used when you receive alerts from external security tools and need to create corresponding records in SOAR for tracking and investigation.
What makes this action powerful is its built-in intelligence for handling duplicate records. You can specify which fields should be unique - for example, ensuring you don’t create multiple alerts for the same IP address or incident.
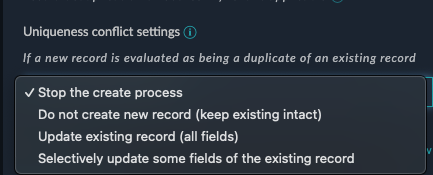
When SOAR detects that a new record would duplicate an existing one based on your uniqueness rules, you have several options for how to handle the situation. Instead of creating a duplicate record, you can choose to update the existing record with new information, skip the creation entirely, or take other custom actions. This prevents your system from being cluttered with duplicate entries while ensuring important information isn’t lost.
For instance, if your playbook tries to create an alert for IP address 192.168.1.100 but an alert for that IP already exists, SOAR can automatically update the existing alert with any new details rather than creating a second alert for the same IP address.
Update any record in SOAR. In order to upgrade records, you need to know the record’s “IRI” which is a unique identified. An example of this would be a step that changes an alerts status from New to In progress automatically after the playbook looks up information. Often used as an “enriching” step.
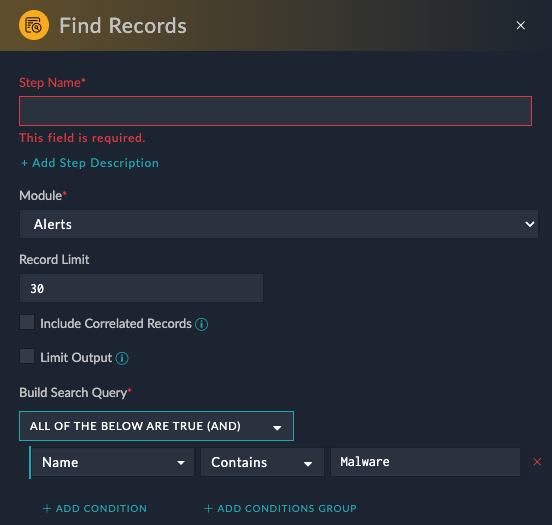
Use the Find Records step to find a record in a module within FortiSOAR, using a query or search criteria. You can build nested queries and use any field to search for records
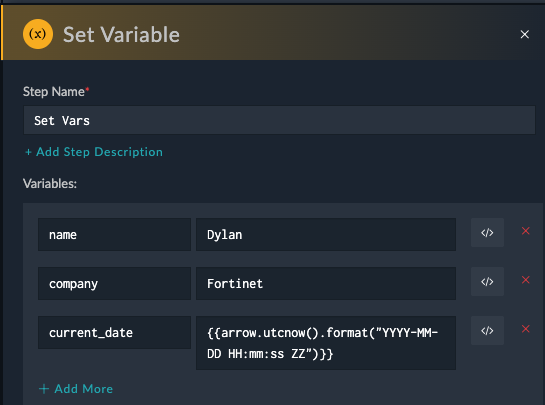
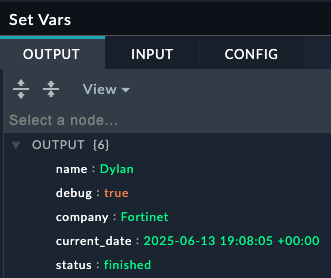
Oftentimes you want to save specific information from a step, or have a dedicated step to use as a midpoint before another step in order to do data transformation or extraction. Set variables are also used to “see” what the data looked like at particular point in the playbook.
 Before
 After
After
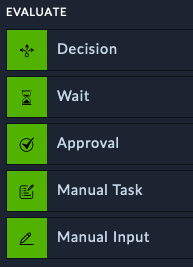
Evaluate actions are used to make decisions, gather input from analysts, or halt a playbook. They can be used to check if a condition is true or false and then take different actions based on the result.
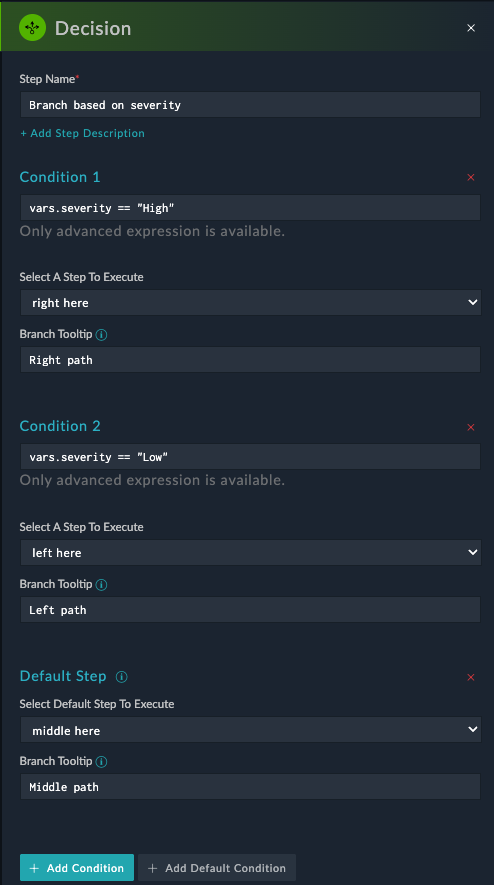
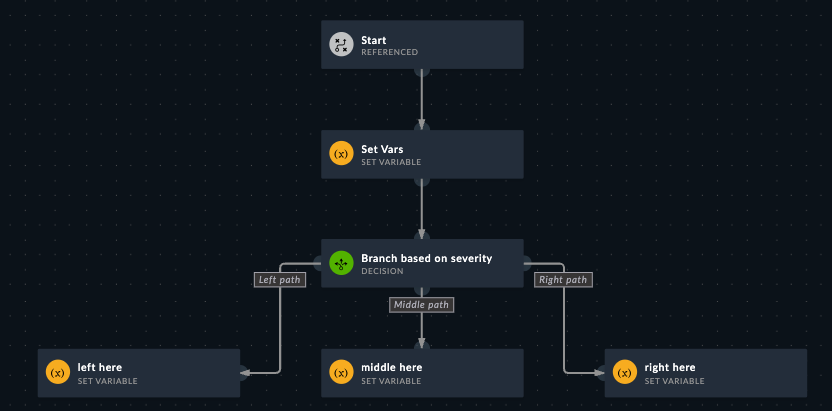
This step lets you use Jinja to use simple or complex logic to “route” which path the playbook takes. For example, If Severity is “Low”, take the left path, or if it’s “High”, take the right path, else take the middle
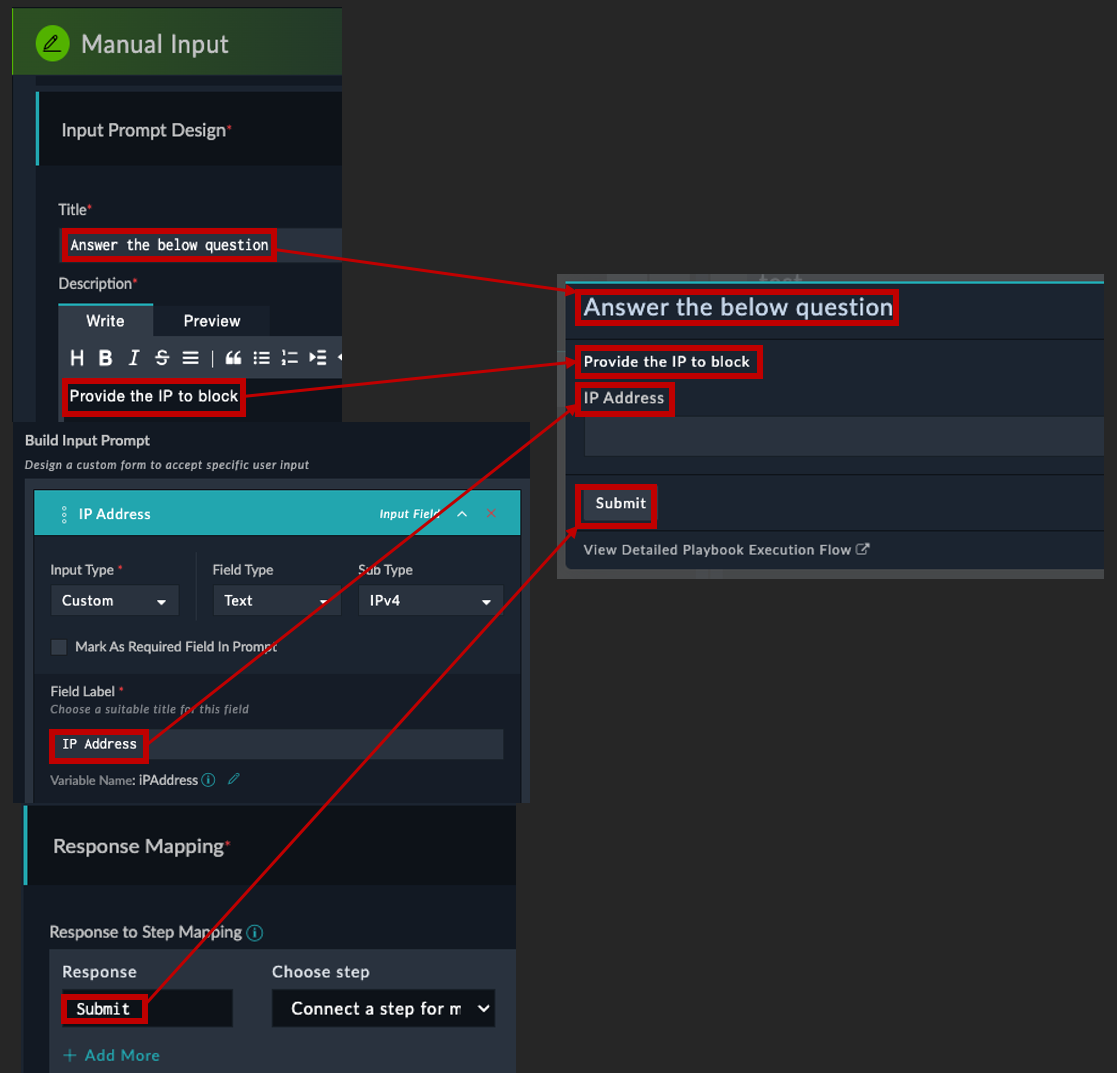
This step lets you build an input form in case you need a user to provide information to a playbook, or use it to simply have two buttons which could have the playbook take either Path A or Path B depending on the button.
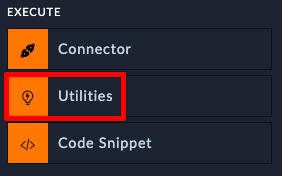
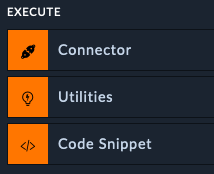
Execute actions let you use any of the configured Connectors to perform actions on external systems. Utilities is a special connector that has common utility-like actions. The Code Snippet connector allows you to write and execute raw Python code.
FortiSOAR has prebuilt connectors to various tools and products, all you need to do is provide credentials to get access to them. Afterwards you can use the visual editor to pick which action you want on the step
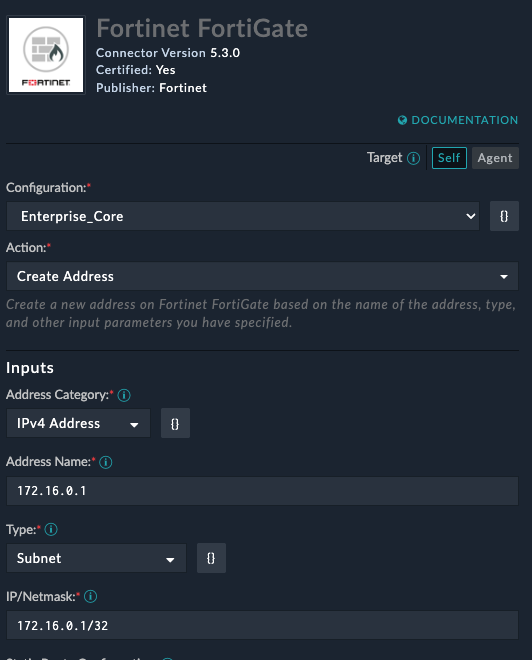
Here’s an example of using the FortiGate connector to create an address objects
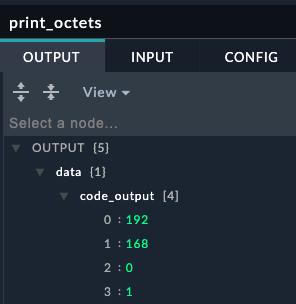
Code snippet is a special connector that lets you run python code from a playbook. Here is an example of using python to break up an ip address into octets. The first picture shows the playbook editor step, and the second shows what is printed from the playbook execution history

 —->
—-> 
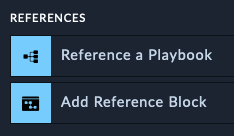
Reference a Playbook lets you execute another playbook from within the current playbook. This is useful for reusing common tasks across multiple playbooks. In that context, the playbook being called is often referred to a child playbook, and the playbook calling it is referred to as the parent playbook. The child playbook returns the last step results up to the parent playbook, that way you can use the data returned.
Now that we’ve covered the playbook basics, let’s get hands-on with building a couple of playbooks.
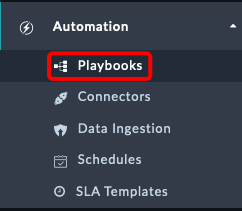
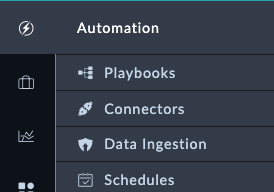
On the left pane Select Automation > Playbooks
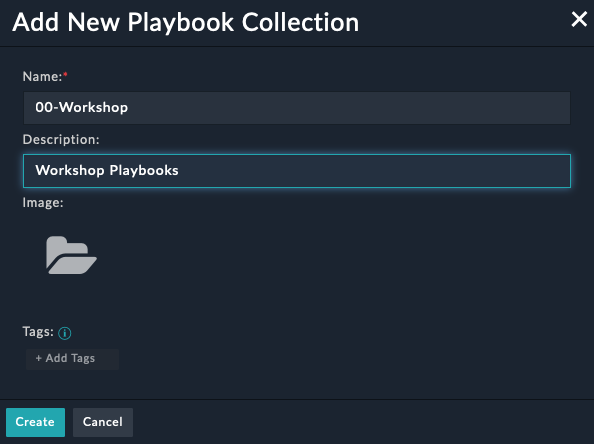
Click the + New Collection Button and enter
00-WorkshopWorkshop PlaybooksClick Create
Click the + New Playbook Button and enter
01-Send EmailSend an email to a yourself from an alert
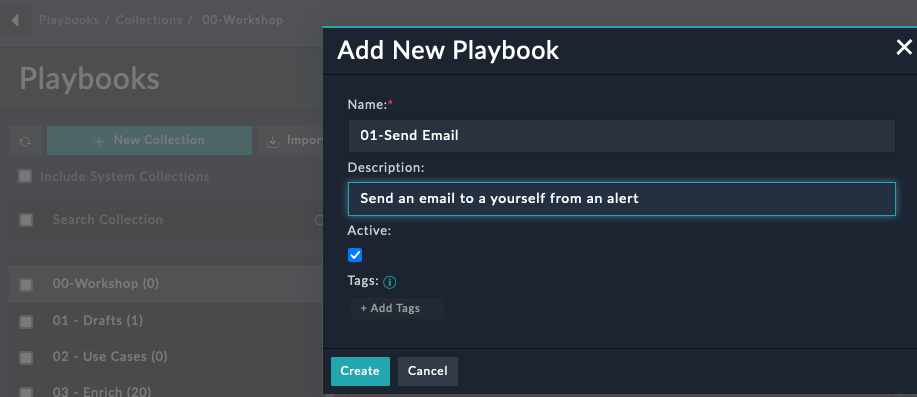
Click Create
Select the Manual Trigger start step and enter
Workshop: Send EmailAlertsYes
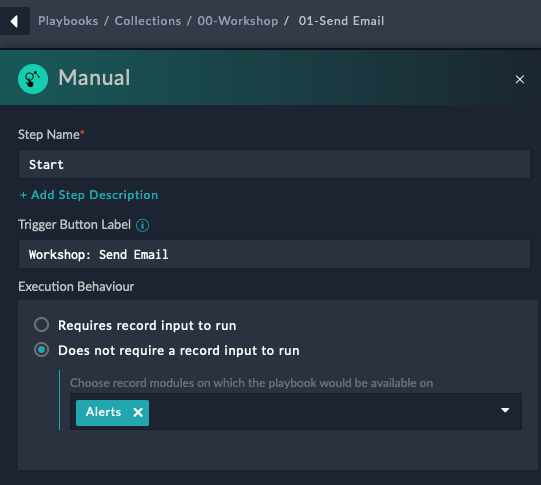
Selecting does not require a record means that we don’t need to have an alert to start the playbook. This is useful for testing and for playbooks that don’t need to be tied to an alert.
Click Save
Click and hold the blue glowing arrows and drag your mouse out and let go to create a new action step. This will pop up the list of steps we can choose next

Select the Send Email action, towards the bottom left of the page
Fill in the fields
Send EmailSend EmailThis is a test email from FortiSOARTest EmailWhen sending an email to Fortinet email address in the To field, it’s recommended to also add a personal email address. This precaution is recommended to ensure any email inspection doesn’t block the request
Click Save
Click Save Playbook at the top right of the page
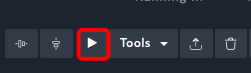
Click the play button (Looks like a right arrow) at the top right of the page
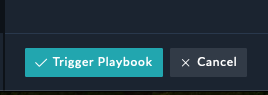
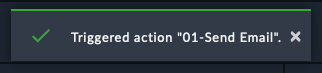
Click the Trigger Playbook button at the bottom left of the page. You should see the execution of the playbook pop up after this
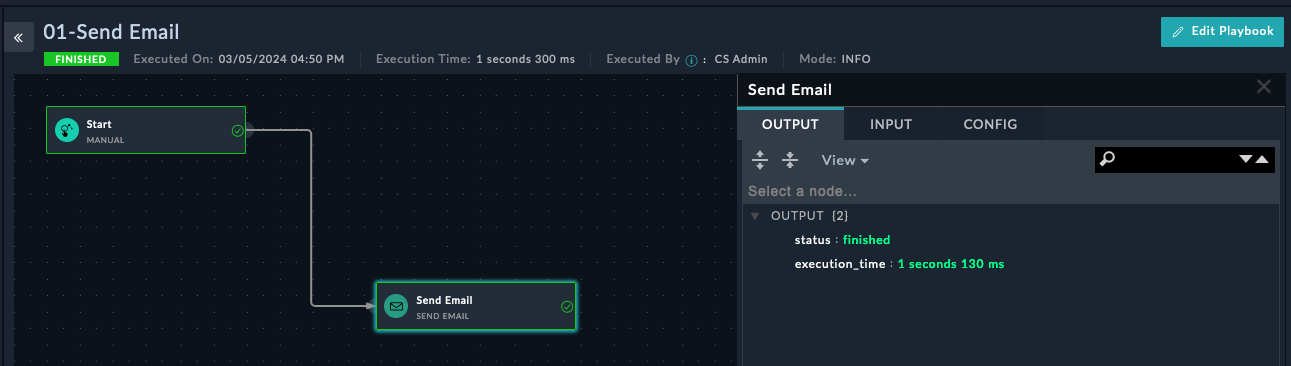
You have now created and triggered your first playbook. You should receive an email shortly.
You can click on the step output to see the details of the step. This is useful for debugging and understanding what is happening in the playbook.
You will see a popup showing the playbook executed. You should receive another email shortly.
Reach out to the instructor if you need help with the challenges.
Create a playbook that triggers when an incident is created AND the severity is critical AND the type is Lateral Movement. The playbook should email an address of your choosing.
Create a manual trigger playbook that prompts the user for an IP address and then blocks the IP address on a FortiGate.
Create a playbook that adds the text Alert has been Closed to the description field of an alert when the status is updated to Closed.
Welcome to this comprehensive guide on using Jinja templates for FortiGate configuration management. This tutorial is designed specifically for those who want to automate and standardize their Fortinet device configurations without requiring extensive programming knowledge.
Jinja2 is a powerful templating language that allows you to create dynamic text-based documents. Instead of manually creating individual configuration files for each FortiGate device, you can create one template and automatically generate customized configurations for hundreds of devices.
Some notable tools that use Jinja2 for network automation include:
Jinja2 needs two main components to generate a configuration:
graph LR
    A[Template File] --> C["Jinja Engine (FortiSOAR)"]
    B[Data Values] --> C
    C --> D[Generated Configuration]

    classDef default fill:#f8fafc,stroke:#374151,stroke-width:2px,color:#1f2937
    classDef engine fill:#4f46e5,stroke:#312e81,stroke-width:3px,color:#ffffff

    class C engine

    linkStyle 0 stroke:#dc2626,stroke-width:3px
    linkStyle 1 stroke:#dc2626,stroke-width:3px
    linkStyle 2 stroke:#dc2626,stroke-width:3px
The template contains your standard FortiGate configuration with variables marked by special syntax, and the data provides the specific values for each device.
Before diving into Jinja templates, let’s understand JSON (JavaScript Object Notation) - the format we’ll use to store our configuration data.
JSON is a simple, text-based format for storing and exchanging data. Think of it as a digital filing system where information is organized in a structured, easy-to-read way. Despite its name mentioning JavaScript, JSON is widely used across all programming languages and automation tools.
JSON has only a few simple rules:
"hostname": "fw-branch-01""hostname": "fw-01", "timezone": "EST"{ "hostname": "fw-01" }["8.8.8.8", "1.1.1.1"]"hostname" not hostnameStrings (Text):
{
  "hostname": "branch-office-fw-01",
  "description": "Main office firewall"
}
Numbers:
{
  "port_number": 443,
  "vlan_id": 100,
  "mtu": 1500
}
Lists/Arrays (Multiple Values):
{
  "dns_servers": [
    "8.8.8.8",
    "1.1.1.1"
  ],
  "allowed_ports": [
    80,
    443,
    22,
    3389
  ]
}
Objects (Grouped Information):
{
  "interface": {
    "name": "port1",
    "ip": "192.168.1.1",
    "mask": "255.255.255.0"
  }
}Let’s start with a simple FortiGate configuration example to understand how Jinja variable substitution works.
Here’s a typical FortiGate system configuration snippet:
config system global
    set hostname "branch-office-fw-01"
    set timezone "America/New_York"
end

config system dns
    set primary 8.8.8.8
    set secondary 1.1.1.1
end

config system ntp
    set ntpsync enable
    set server-mode disable
    set syncinterval 60
    config ntpserver
        edit 1
            set server "pool.ntp.org"
            set ntpv3 enable
        next
    end
endThe first step is identifying which parts should be variables. In our example:
Here’s the same configuration as a Jinja template:
config system global
    set hostname "{{ hostname }}"
    set timezone "{{ timezone }}"
end

config system dns
    set primary {{ dns_primary }}
    set secondary {{ dns_secondary }}
end

config system ntp
    set ntpsync enable
    set server-mode disable
    set syncinterval 60
    config ntpserver
        edit 1
            set server "{{ ntp_server }}"
            set ntpv3 enable
        next
    end
endIn Jinja2, anything between {{ }} (double curly braces) tells the engine to:
{{ variable_name }} with the variable’s valueThe data that feeds into our template is stored in JSON format:
{
  "hostname": "branch-office-fw-01",
  "timezone": "America/New_York",
  "dns_primary": "8.8.8.8",
  "dns_secondary": "1.1.1.1",
  "ntp_server": "pool.ntp.org"
}When the template is processed with the JSON data above, it produces:
config system global
    set hostname "branch-office-fw-01"
    set timezone "America/New_York"
end

config system dns
    set primary 8.8.8.8
    set secondary 1.1.1.1
end

config system ntp
    set ntpsync enable
    set server-mode disable
    set syncinterval 60
    config ntpserver
        edit 1
            set server "pool.ntp.org"
            set ntpv3 enable
        next
    end
endLet’s practice basic variable substitution using the FortiSOAR Jinja Editor.
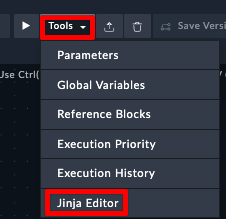
To access the Jinja Editor:
On the left pane, navigate to Automation > Playbooks
Create a new playbook or edit an existing one
Click the Tools dropdown on the top right and select Jinja Editor
Exercise:
In the Jinja Editor, you’ll see two panels:
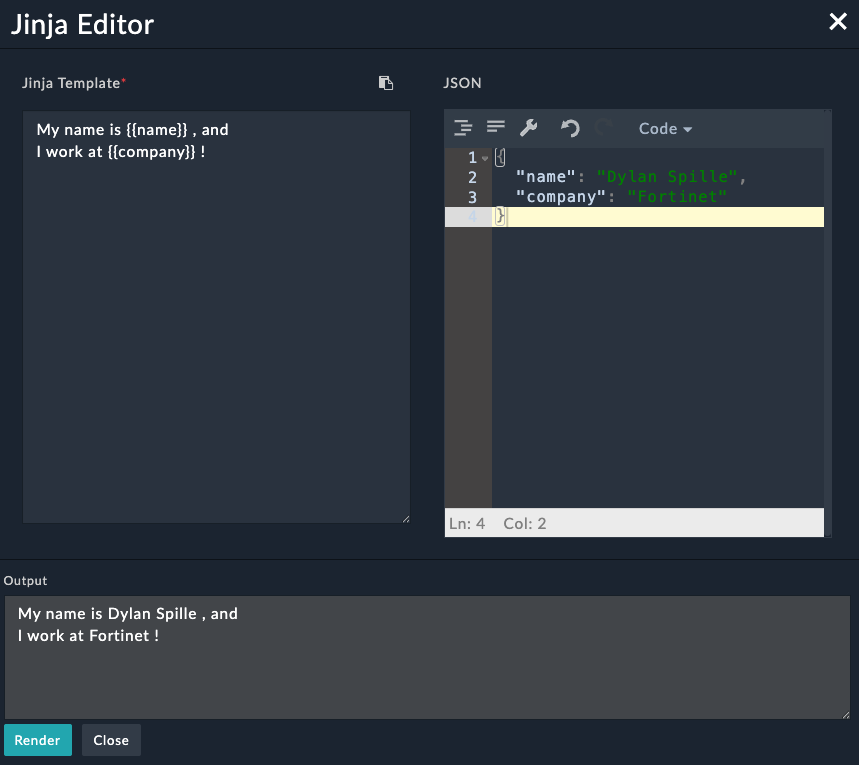
Click Render to see the output of the Template
Task: Create a simple firewall policy configuration using variables.
Step 1: Copy this JSON data into the right panel:
{
  "policy_name": "Allow_Web_Traffic",
  "source_interface": "port1",
  "destination_interface": "port2",
  "source_address": "Internal_LAN",
  "destination_address": "all",
  "service": "HTTPS"
}
Step 2: Create a Jinja template in the right panel that generates this output:
config firewall policy
    edit 0
        set name "Allow_Web_Traffic"
        set srcintf "port1"
        set dstintf "port2"
        set srcaddr "Internal_LAN"
        set dstaddr "all"
        set service "HTTPS"
        set action accept
    next
end
Try writing the template yourself first!
Real network configurations often require more complex data organization. Let’s explore how to work with JSON objects and arrays in Jinja templates.
Instead of having separate variables for each interface attribute, we can group related information together using JSON objects:
{
  "interface": {
    "name": "port1",
    "ip": "192.168.1.1",
    "netmask": "255.255.255.0",
    "description": "LAN Interface",
    "status": "up"
  }
}
JSON Object Explanation:
interface contains a nested object (another set of curly braces)Jinja provides convenient “dot notation” to access JSON object values:
config system interface
    edit "{{ interface.name }}"
        set ip {{ interface.ip }} {{ interface.netmask }}
        set description "{{ interface.description }}"
        set status {{ interface.status }}
    next
end
This approach makes templates more readable and data more organized.
Task: Create a template for configuring multiple FortiGate interfaces using nested JSON objects.
Step 1: Copy this JSON data into the right panel:
{
  "device_name": "FW-BRANCH-01",
  "interfaces": {
    "lan": {
      "name": "port1",
      "ip": "192.168.1.1",
      "netmask": "255.255.255.0",
      "description": "LAN Interface",
      "allowaccess": "ping https ssh"
    },
    "wan": {
      "name": "port2",
      "ip": "203.0.113.10",
      "netmask": "255.255.255.252",
      "description": "WAN Interface",
      "allowaccess": "ping"
    },
    "dmz": {
      "name": "port3",
      "ip": "10.10.10.1",
      "netmask": "255.255.255.0",
      "description": "DMZ Interface",
      "allowaccess": "ping https"
    }
  }
}
Step 2: Write a template that configures all three interfaces. Your output should look like this:
# Configuration for FW-BRANCH-01

config system interface
    edit "port1"
        set ip 192.168.1.1 255.255.255.0
        set description "LAN Interface"
        set allowaccess ping https ssh
    next
    edit "port2"
        set ip 203.0.113.10 255.255.255.252
        set description "WAN Interface"
        set allowaccess ping
    next
    edit "port3"
        set ip 10.10.10.1 255.255.255.0
        set description "DMZ Interface"
        set allowaccess ping https
    next
endJSON arrays are perfect for lists of similar items like DNS servers, VLANs, or firewall rules:
{
  "dns_servers": [
    "8.8.8.8",
    "1.1.1.1",
    "208.67.222.222"
  ],
  "vlans": [
    {
      "id": 10,
      "name": "LAN",
      "description": "Main LAN network"
    },
    {
      "id": 20,
      "name": "DMZ",
      "description": "DMZ network"
    }
  ]
}
JSON Array Explanation:
[ ]Task: Practice accessing individual elements from JSON arrays.
Step 1: Copy this JSON data:
{
  "ntp_servers": [
    "0.pool.ntp.org",
    "1.pool.ntp.org",
    "2.pool.ntp.org"
  ],
  "admin_users": [
    {
      "username": "admin",
      "profile": "super_admin",
      "password": "FortiGate123!"
    },
    {
      "username": "monitor",
      "profile": "read_only",
      "password": "Monitor456!"
    }
  ]
}
Step 2: Create a template that:
Expected output:
config system ntp
    set ntpsync enable
    config ntpserver
        edit 1
            set server "0.pool.ntp.org"
        next
        edit 2
            set server "1.pool.ntp.org"
        next
    end
end

config system admin
    edit "admin"
        set password "FortiGate123!"
        set accprofile "super_admin"
    next
    edit "monitor"
        set password "Monitor456!"
        set accprofile "read_only"
    next
endWhat if we added another ntp server or user? With this declaration we’d have to update our JSON and our jinja template. Could this be optimized by using a loop somehow?
Sometimes you might have property names with special characters (like IP addresses as keys). When this happens, you can’t use dot notation and must use bracket notation instead:
{
  "subnets": {
    "192.168.1.0/24": {
      "description": "Main LAN",
      "vlan": 10
    },
    "10.0.0.0/8": {
      "description": "Private Network",
      "vlan": 20
    }
  }
}
Template usage:
# For subnet 192.168.1.0/24
Description: {{ subnets['192.168.1.0/24'].description }}
VLAN: {{ subnets['192.168.1.0/24'].vlan }}Task: Use the above JSON in the Jinja Editor, and try to access the subnets without using bracket notation. What kind of error do you see?
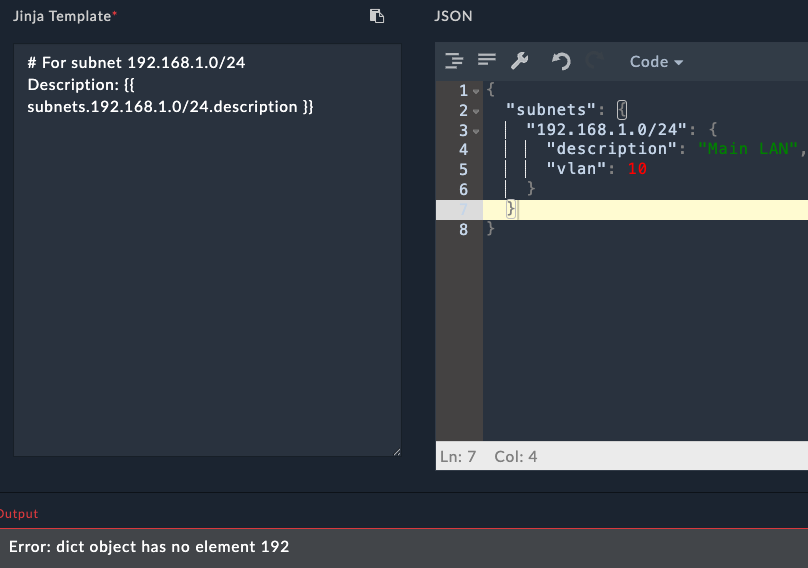 We see an error that the subnets dictionary doesn’t have a key named “192” . This is because the special character
 . is getting treated as its own key.
Common JSON Mistakes to Avoid:
Valid JSON:
{
  "hostname": "fw-01",
  "ports": [
    80,
    443
  ]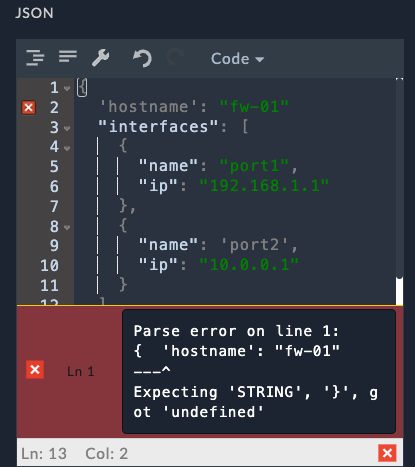
}Task: The following JSON has several errors. Try to fix them in the Jinja Editor.
{
  'hostname': "fw-01"
  "interfaces": [
    {
      "name": "port1",
      "ip": "192.168.1.1"
    },
    {
      "name": 'port2',
      "ip": "10.0.0.1"
    }
  ]
}Notice how SOAR will also mention that there were issues with the JSON, which speeds up the resolution process.
Note
Understanding how Jinja handles missing variables is crucial for creating robust templates.
By default, if a variable is not defined in your JSON data, Jinja will replace it with an empty string. This can lead to unexpected results in your FortiGate configurations.
Task: See what happens when variables are missing from your JSON data.
Step 1: Copy this JSON data (notice it’s missing the location field):
{
  "hostname": "FW-HQ-01",
  "timezone": "America/New_York"
}
Step 2: Use this template:
config system global
    set hostname "{{ hostname }}"
    set timezone "{{ timezone }}"
    set location "{{ location }}"
end
Step 3: Observe the output. What happens to the location line?
Comments are essential for maintaining templates, especially when multiple team members work on the same configurations.
Jinja uses {# ... #} for comments. Everything between these markers is ignored during template processing.
{# FortiGate Basic System Configuration Template #}
{# Version: 1.0 #}
{# Author: Network Team #}

config system global
    set hostname "{{ hostname }}"  {# Device hostname #}
    set timezone "{{ timezone }}"
endComments are valuable for:
Task: Practice using comments in your templates.
Step 1: Use this JSON data:
{
  "hostname": "FW-TEST-01",
  "timezone": "UTC",
  "ntp_server": "pool.ntp.org",
  "admin_timeout": 480
}
Step 2: Use this template:
{#
   FortiGate System Configuration Template
   Version: 2.0
   Last Updated: 2025-06-09
   Purpose: Standard system settings for all branch firewalls
#}

config system global
    set hostname "{{ hostname }}"  {# Unique identifier for this device #}
    set timezone "{{ timezone }}"  {# Use UTC for global deployments #}
    set admin-timeout {{ admin_timeout }}  {# Session timeout in seconds #}
end

{# NTP configuration - uncomment when ready to deploy
config system ntp
    set ntpsync enable
    config ntpserver
        edit 1
            set server "{{ ntp_server }}"
        next
    end
end
#}

{# TODO: Add DNS configuration in next version #}
Step 3: Check the output. Notice how all comments are removed from the final configuration.
In this hands-on guide, you’ve learned:
{{ variable_name }} syntaxThese fundamentals form the foundation for more advanced Jinja features like loops, conditionals, and filters, which you’ll explore in future lessons.
Welcome to the advanced Jinja templating guide! Building on the basics, we’ll explore conditionals, loops, and filters - the powerful features that make Jinja templates truly dynamic and efficient for FortiGate configuration management.
Conditionals allow your templates to make decisions and generate different configurations based on your data.
Jinja uses {% if %}, {% elif %}, and {% else %} for conditional logic:
{% if condition %}
    {# Configuration when condition is true #}
{% elif other_condition %}
    {# Alternative configuration #}
{% else %}
    {# Default configuration #}
{% endif %}== (equal), != (not equal)>, >=, <, <= (comparisons)and, or, not (logical operators)Task: Create a template that uses different SSL VPN configurations based on FortiOS version.
JSON Data:
{
  "hostname": "FW-BRANCH-01",
  "fortios_version": 7.4,
  "ssl_vpn_port": 8443,
  "users": [
    "alice",
    "bob",
    "charlie"
  ]
}
Expected Output for FortiOS 7.4:
config system global
    set hostname "FW-BRANCH-01"
end

config vpn ssl settings
    set port 8443
    set tunnel-ip-pools "SSLVPN_TUNNEL_ADDR1"
    set tunnel-ipv6-pools "SSLVPN_TUNNEL_IPv6_ADDR1"
    set source-interface "port1"
end
Expected Output for FortiOS 7.0:
config system global
    set hostname "FW-BRANCH-01"
end

config vpn ssl settings
    set port 8443
    set tunnel-ip-pools "SSLVPN_TUNNEL_ADDR1"
    set source-interface "port1"
end
Your Task: Write a template that includes IPv6 pools only for FortiOS 7.2 and above.
Tests check properties of variables and return True/False:
is defined - Check if variable existsis string, is number - Check data typesis iterable - Check if can be looped overTask: Create a template that safely handles optional configuration parameters.
JSON Data:
{
  "hostname": "FW-TEST-01",
  "timezone": "America/New_York",
  "admin_timeout": 480,
  "ntp_servers": [
    "pool.ntp.org",
    "time.google.com"
  ]
}
Your Task: Write a template that:
Loops let you generate repetitive configurations efficiently using arrays and objects in your JSON data.
{% for item in collection %}
    {{ item }}
{% endfor %}Inside loops, Jinja provides helpful variables:
loop.index - Current iteration (1-based)loop.index0 - Current iteration (0-based)loop.first - True on first iterationloop.last - True on last iterationTask: Generate configuration for multiple interfaces using a loop.
JSON Data:
{
  "interfaces": [
    {
      "name": "port1",
      "ip": "192.168.1.1",
      "netmask": "255.255.255.0",
      "description": "LAN Interface",
      "allowaccess": [
        "ping",
        "https",
        "ssh"
      ]
    },
    {
      "name": "port2",
      "ip": "203.0.113.10",
      "netmask": "255.255.255.252",
      "description": "WAN Interface",
      "allowaccess": [
        "ping"
      ]
    },
    {
      "name": "port3",
      "ip": "10.10.10.1",
      "netmask": "255.255.255.0",
      "description": "DMZ Interface",
      "allowaccess": [
        "ping",
        "https"
      ]
    }
  ]
}
Your Task: Create a template that configures all interfaces.
When your JSON uses objects instead of arrays, you can loop over key-value pairs:
{% for key, value in dictionary.items() %}
    Key: {{ key }}, Value: {{ value }}
{% endfor %}Task: Configure VLANs using a dictionary structure.
JSON Data:
{
  "vlans": {
    "10": {
      "name": "USERS",
      "description": "User workstations",
      "interface": "port1"
    },
    "20": {
      "name": "SERVERS",
      "description": "Server network",
      "interface": "port1"
    },
    "30": {
      "name": "GUESTS",
      "description": "Guest network",
      "interface": "port1"
    }
  }
}
Expected Output:
config system interface
    edit "USERS"
        set vdom "root"
        set vlanid 10
        set interface "port1"
        set description "User workstations"
    next
    edit "SERVERS"
        set vdom "root"
        set vlanid 20
        set interface "port1"
        set description "Server network"
    next
    edit "GUESTS"
        set vdom "root"
        set vlanid 30
        set interface "port1"
        set description "Guest network"
    next
endYou can filter items during loops using if:
{% for item in collection if item.status == 'active' %}
    {{ item.name }}
{% endfor %}Task: Configure only interfaces that have IP addresses assigned.
JSON Data:
{
  "interfaces": [
    {
      "name": "port1",
      "ip": "192.168.1.1",
      "netmask": "255.255.255.0",
      "description": "LAN Interface"
    },
    {
      "name": "port2",
      "description": "Unused port"
    },
    {
      "name": "port3",
      "ip": "10.10.10.1",
      "netmask": "255.255.255.0",
      "description": "DMZ Interface"
    }
  ]
}
Your Task: Only configure interfaces that have an ip field defined.
Filters transform data in your templates. They’re applied using the pipe | symbol.
Combines array elements into a string:
{{ servers | join(' ') }}Provides fallback values:
{{ timeout | default(300) }}Gets the count of items:
{% if users | length > 10 %}Changes text case:
{{ hostname | upper }}{{ "branch-office-firewall" | replace('-', '_') | upper }}
> BRANCH_OFFICE_FIREWALLFortiSOAR has documentation of all the available Jinja filters here
Task: Use filters to create firewall policies with proper formatting.
JSON Data:
{
  "policies": [
    {
      "name": "allow_web_traffic",
      "srcintf": [
        "port1",
        "port3"
      ],
      "dstintf": [
        "port2"
      ],
      "srcaddr": [
        "internal_users",
        "dmz_servers"
      ],
      "dstaddr": [
        "all"
      ],
      "service": [
        "HTTP",
        "HTTPS"
      ],
      "action": "accept",
      "log": true
    },
    {
      "name": "allow_dns",
      "srcintf": [
        "port1"
      ],
      "dstintf": [
        "port2"
      ],
      "srcaddr": [
        "internal_users"
      ],
      "dstaddr": [
        "all"
      ],
      "service": [
        "DNS"
      ],
      "action": "accept"
    }
  ]
}
Your Task: Create firewall policies using filters to join arrays and provide defaults.
Extracts specific attributes from objects:
{{ interfaces | map(attribute='name') | join(' ') }}Filters items based on conditions:
{{ vlans | selectattr('active', 'equalto', true) }}Groups items by an attribute:
{% for status, interfaces in all_interfaces | groupby('status') %}You can combine multiple filters:
{{ servers | map(attribute='name') | join(', ') }}You’ve learned to use Jinja’s most powerful features:
Conditionals:
{% if %}, {% elif %}, {% else %}is defined, is stringLoops:
{% for item in list %}{% for key, value in dict.items() %}ifloop.index, loop.first, etc.)Filters:
join, default, length, upper/lowermap, select/reject, groupby|Practice combining these features to create sophisticated FortiGate configurations. Start simple and gradually add complexity as you become more comfortable with the syntax and concepts.
Now that you have the foundations of Jinja down, lets transition into applying that knowledge to SOAR. We’ll cover FortiSOAR specific Jinja expressions, the Jinja Expression Helper, as well as how to use Jinja in playbooks
All data in SOAR is accessed using the vars key with Jinja2 templating. Variables are accessed using the pattern:
{{vars.<variable_name>}}The vars object contains all available data during playbook execution, including:
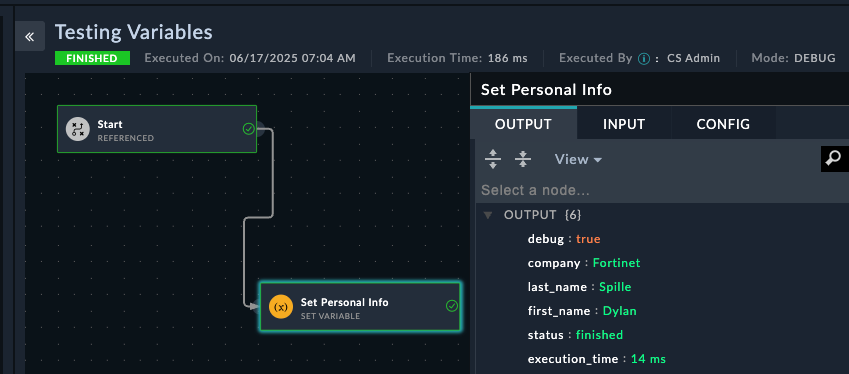
Learn to create variables and reference them in subsequent steps using Jinja2 templating.
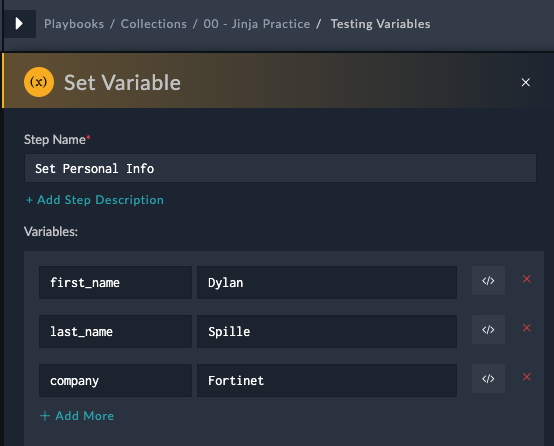
00 - Jinja PracticeTesting VariablesPractice creating and using Jinja2 variablesSet Personal Infofirst_name | Value: [Your First Name]last_name | Value: [Your Last Name]company | Value: [Your Company Name]
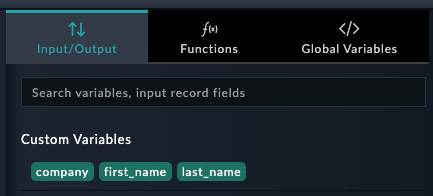
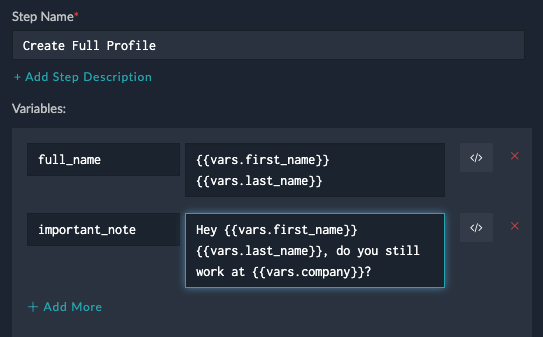
Create Full Profilefull_name{{vars.first_name}} {{vars.last_name}}Using Dynamic Values: Instead of typing Jinja2 manually, you can see the Dynamic Values page by clicking into any field in SOAR. You’ll see your previously created variables at the top of the panel. Clicking these variables will automatically add the jinja to reference that value to your step. This helps prevent typos in variable names.
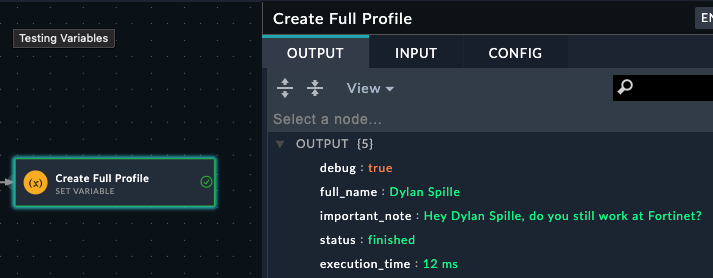
important_noteHey {{vars.first_name}} {{vars.last_name}}, do you still work at {{vars.company}}?
full_name shows your complete nameimportant_note shows the templated message with all variables filled in
Common Mistake: Variable names are case-sensitive and must match exactly. first_name ≠ First_Name. Use the Dynamic Values panel to avoid typos!
From Create Full Profile, drag to create a new step → Select Code Snippet
Configure the step:
Process Name Data# Get the full name from the previous step
name = "{{vars.full_name}}"
company = "{{vars.company}}"
# Perform simple operations
name_length = len(name)
name_upper = name.upper()
name_words = name.split()
word_count = len(name_words)
# Create a processed summary
summary = f"Employee {name_upper} has {word_count} words in their name ({name_length} characters total) and works at {company}"
# Return data for use in next steps
output = {
'processed_name': name_upper,
'character_count': name_length,
'word_count': word_count,
'employee_summary': summary
}
print(output)Click Save
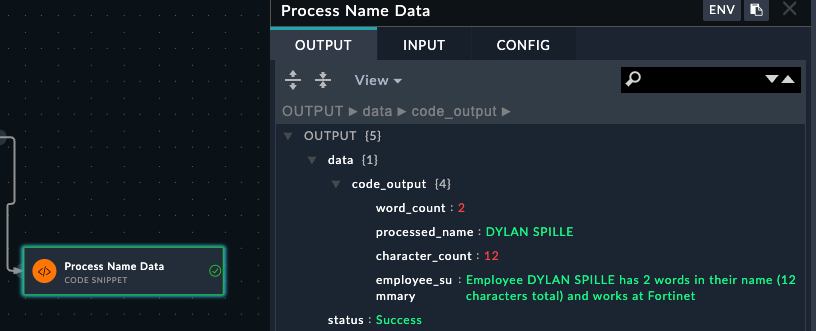
Understanding Step Output: Code snippets return data in the data variable. This becomes accessible as {{vars.steps.Process_Name_Data.data.code_output.processed_name}} or {{vars.steps.Process_Name_Data.data.code_output.employee_summary}} in subsequent steps.
Use the Dynamic values page to pick the results from the code snippet step. When clicking inside the Value, check the box Show Last Run Result if available, then expand the arrows showing the previous data. Clicking on the key employee_summary, fills in the Jinja for you
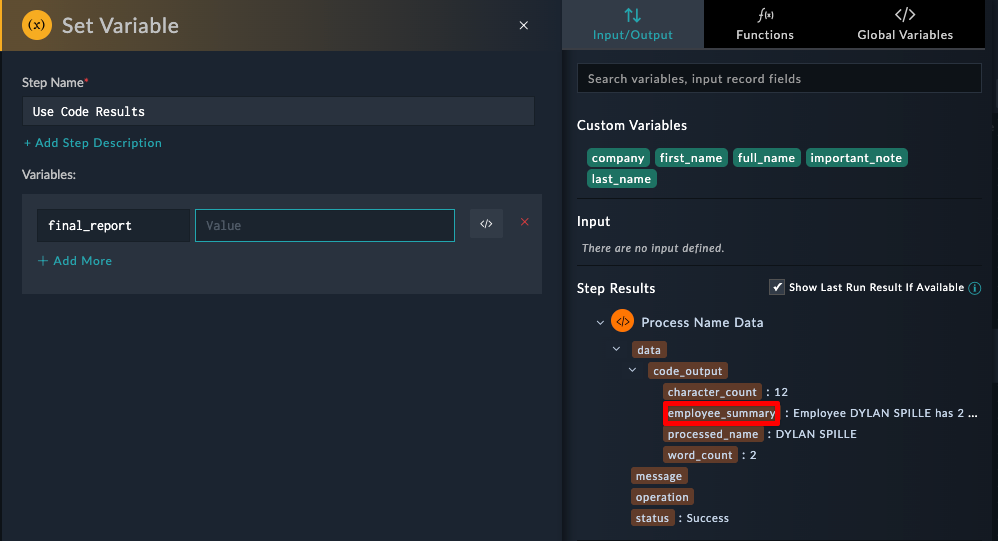
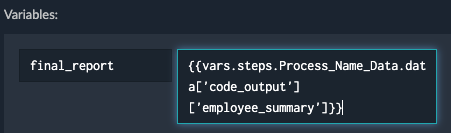
Use Code Resultsfinal_reportname_statsName "{{vars.processed_name}}" has {{vars.steps.character_count}} characters and {{vars.steps.Process_Name_Data.word_count}} words.The jinja for name_stats has been purposefully set to be incorrect. Try to find the issues with each jinja expression and save the playbook and rerun to check the results
Data Path Discovery: Always check the execution results of code snippet steps to see the exact structure of returned data. The JSON structure shown determines how you access the data with {{vars.steps.Step_Name.field_name}}.
When triggering playbooks manually from records (alerts, incidents, etc.), all record data is accessible via vars.input.records. Since records is a list, you typically access data using:
{{vars.input.records[0].<field_name>}}Learn to access and manipulate data from FortiSOAR records using manual triggers.
Working with Alert DataPractice accessing alert data with Jinja2Test Data Access - JinjaAlerts
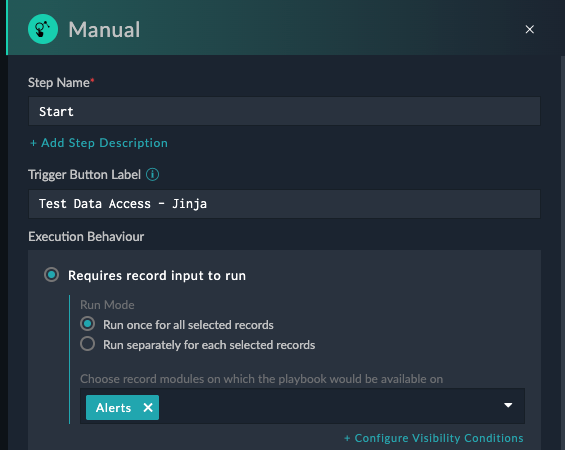
alert_name | Value: {{vars.input.records[0].name}}alert_severity | Value: {{vars.input.records[0].severity}}alert_type | Value: {{vars.input.records[0].type}}source_ip | Value: {{vars.input.records[0].sourceIp}}If you don’t save the playbook, you won’t be able to see the playbook from the alerts page
Sample Alert for Playbook TestingThis is a test alert for learning Jinja2 templatingMediumBrute Force Attempts192.168.1.100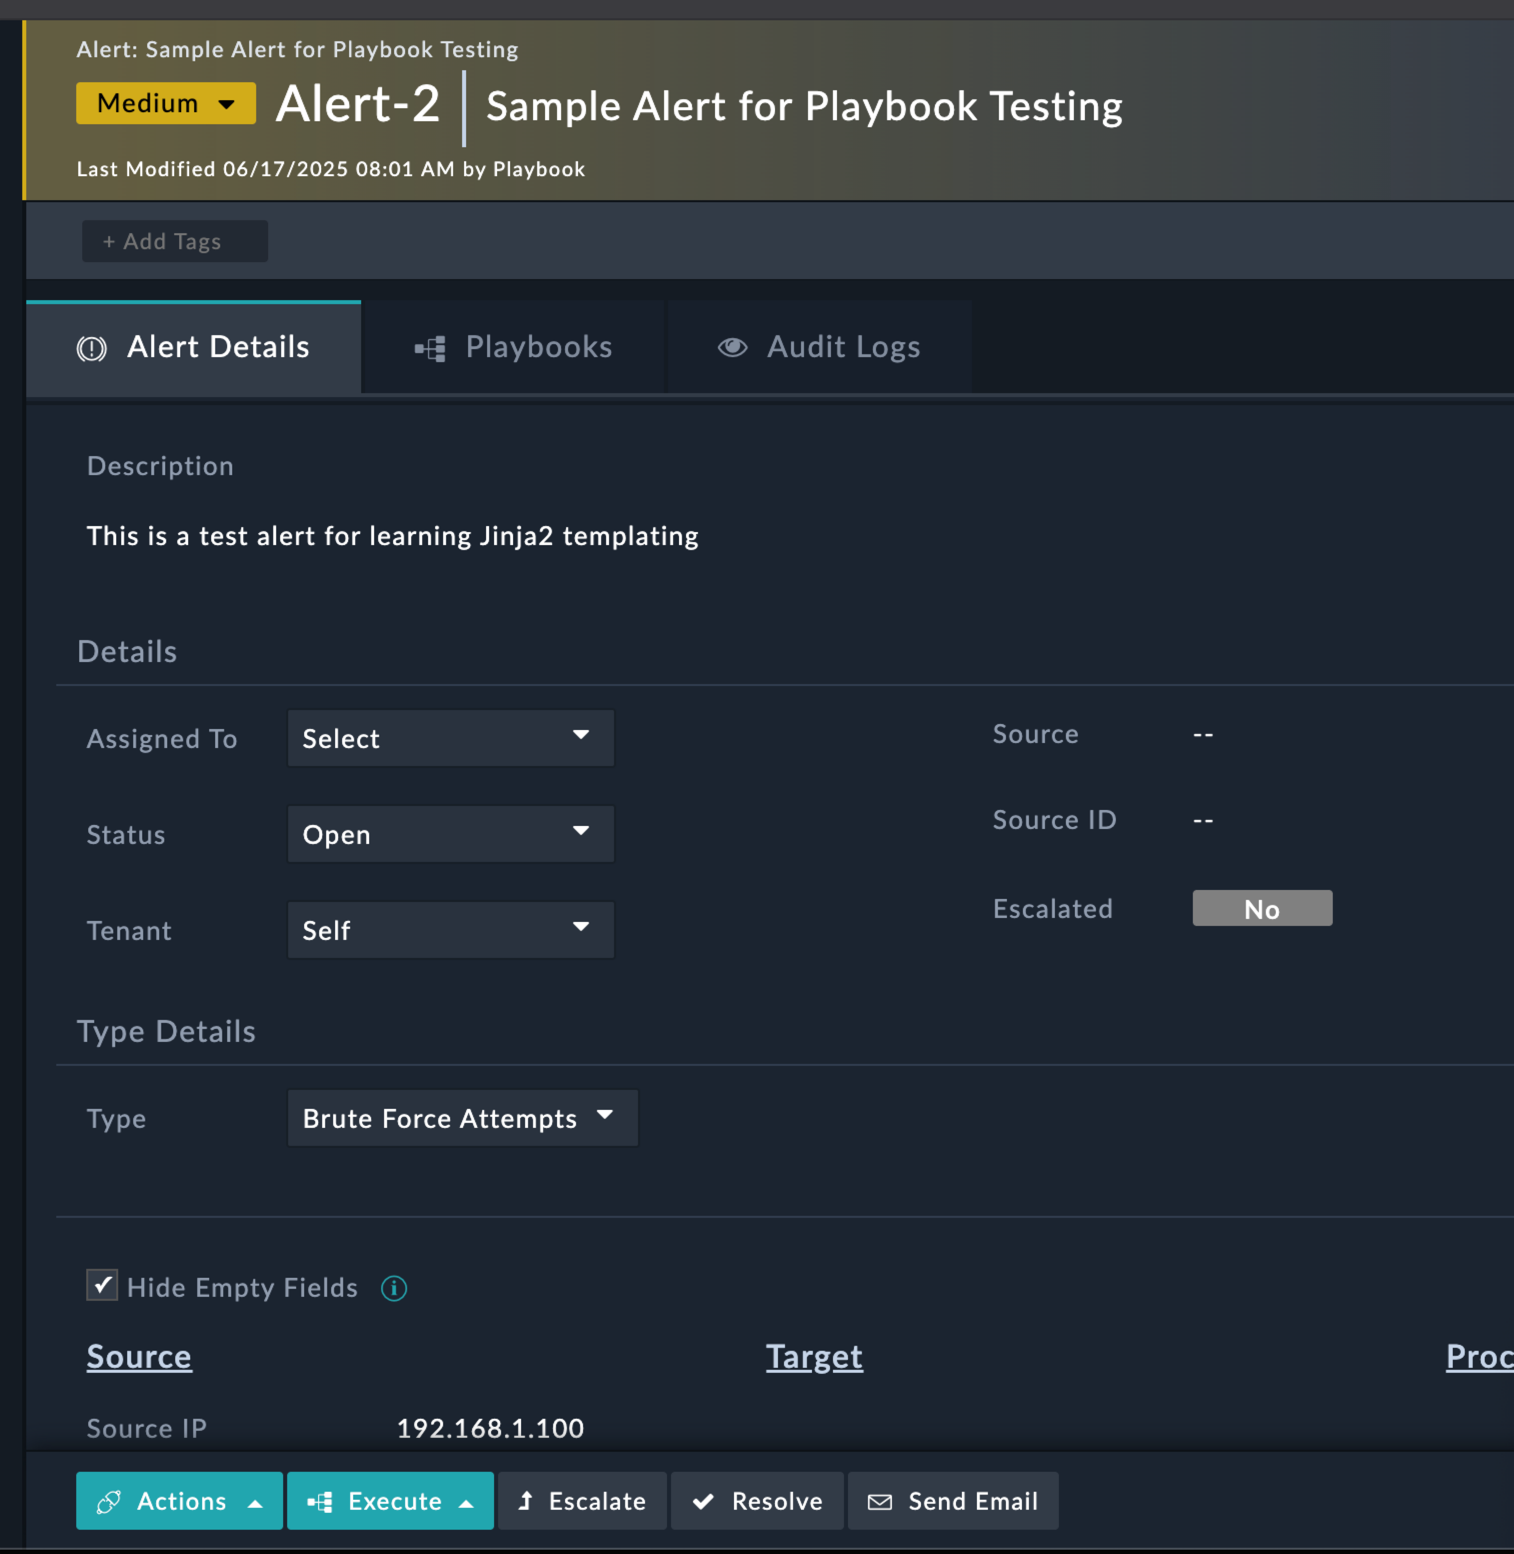

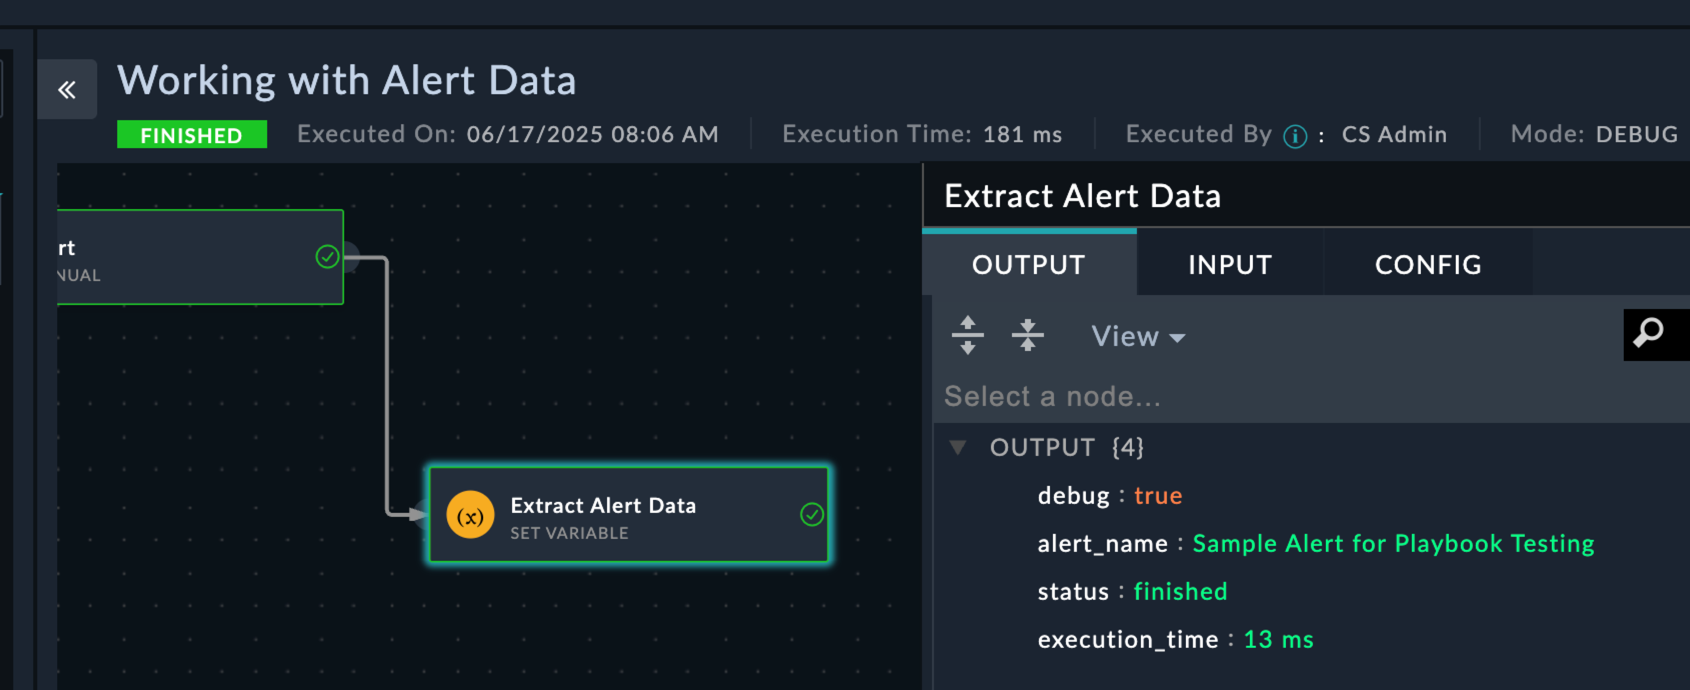
vars > input > records > [0]
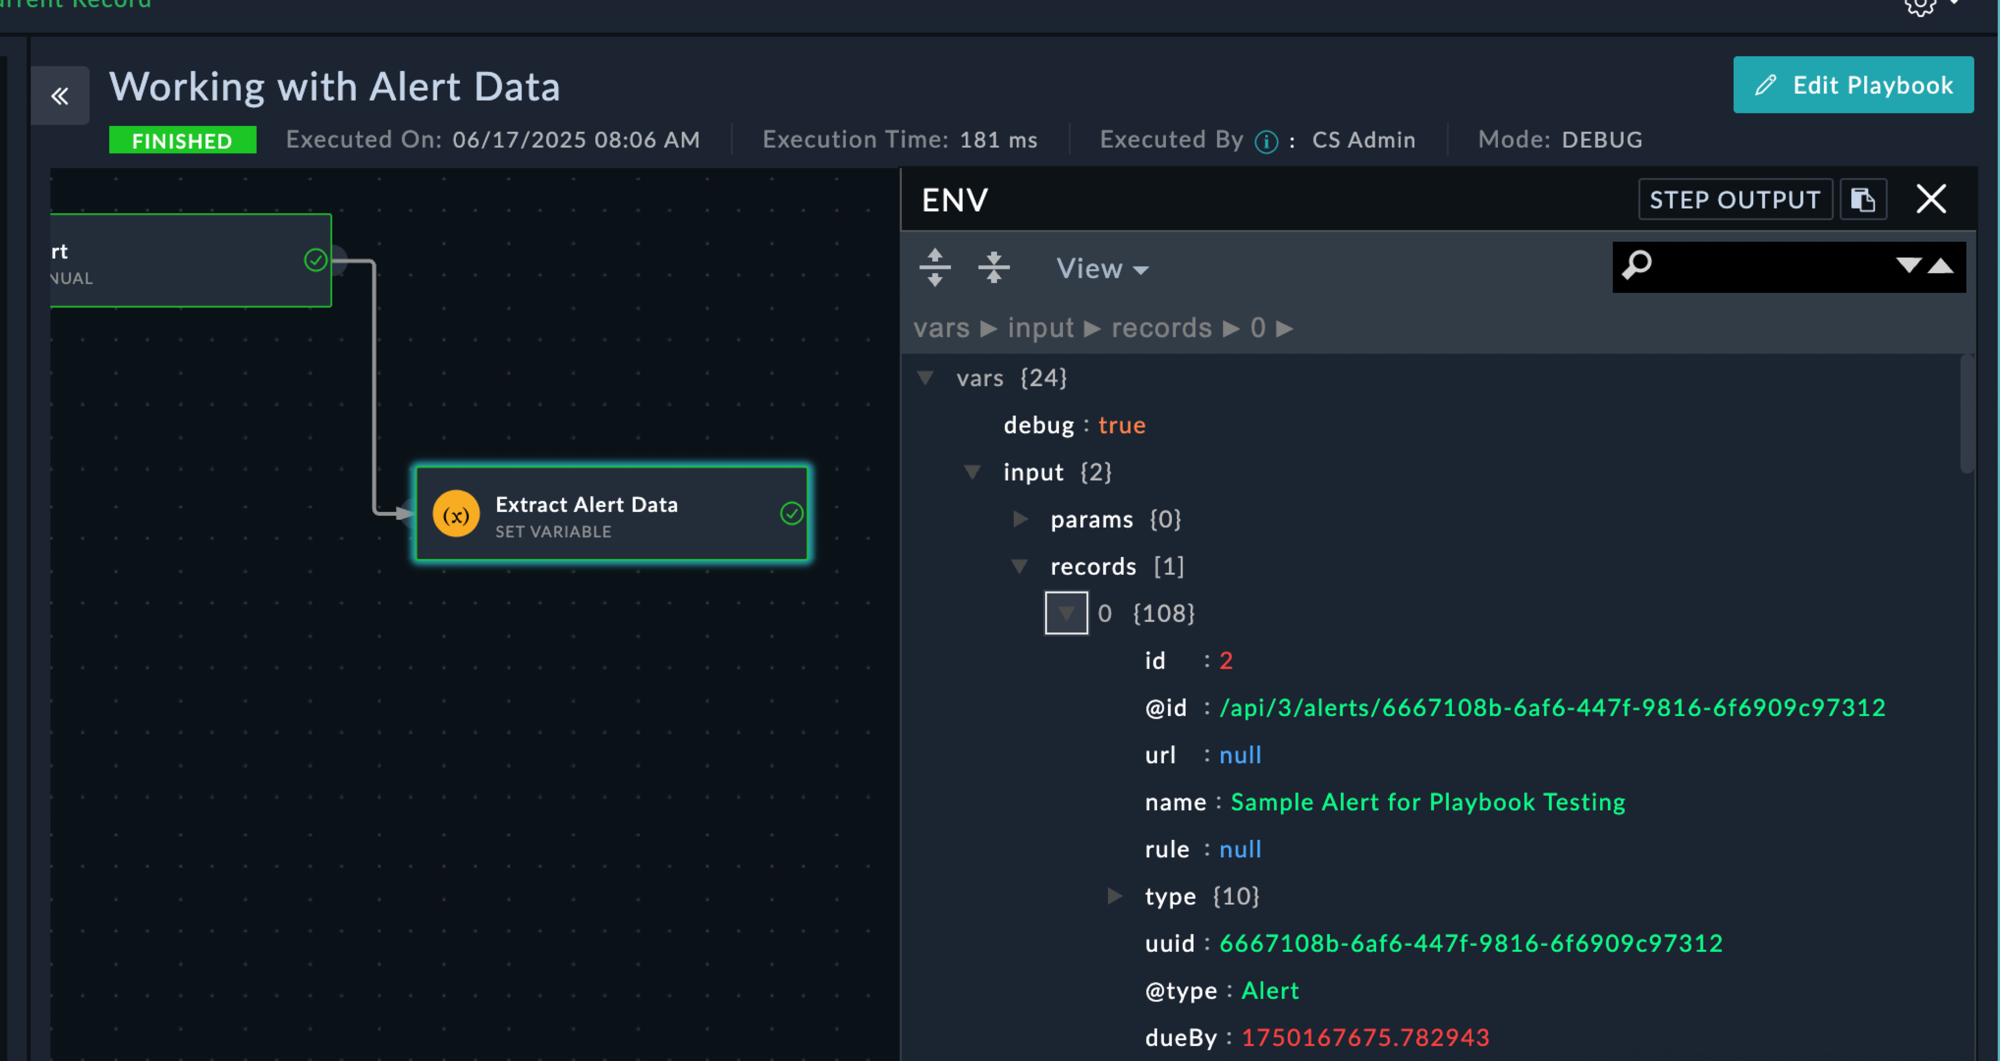
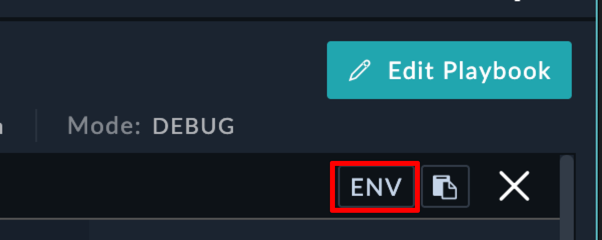
name field matches your alert nameData Exploration: The ENV view shows all data available during playbook execution. This is invaluable for understanding what fields are available and how to access them with Jinja2.
You should now understand why we could access the alert data fro the playbook with vars.input.records[0].<field_name>
Learn advanced Jinja2 techniques for data manipulation and conditional logic.
Advanced Jinja2 TechniquesLearn advanced templating and data manipulation🚀 Advanced TemplatingAnalyze Alert DataRisk Assessment:
Name: risk_level
Value: {% if vars.input.records[0].severity.itemValue == "Critical" %}High Risk{% elif vars.input.records[0].severity.itemValue == "High" %}Medium Risk{% else %}Low Risk{% endif %}
IP Classification:
Name: ip_classification
Value: {% if vars.input.records[0].sourceIp.startswith('10.') %}Internal Network{% elif vars.input.records[0].sourceIp.startswith('192.168.') %}Private Network{% else %}External Network{% endif %}
Alert Summary:
Name: alert_summary
Value: Alert "{{vars.input.records[0].name}}" from {{vars.input.records[0].sourceIp | default('Unknown IP')}} is classified as {{vars.steps.Analyze_Alert_Data.risk_level}} due to {{vars.input.records[0].severity | lower}} severity.Check Risk Level{{vars.risk_level == "High Risk"}}High Risk Actionsrequired_actionsIMMEDIATE ACTIONS REQUIRED:
1. Block IP: {{vars.input.records[0].sourceIp}}
2. Isolate affected systems
3. Notify security team immediately
4. Begin incident response procedures
Alert Details:
- Name: {{vars.input.records[0].name}}
- Time: {{vars.input.records[0].createDate | strftime('%Y-%m-%d %H:%M:%S')}}
- Classification: {{vars.ip_classification}}Standard Processingstandard_actionsSTANDARD MONITORING:
- Continue monitoring {{vars.input.records[0].sourceIp}}
- Log activity for trend analysis
- Review in next security meeting
Risk Assessment: {{vars.risk_level}}<!-- Case conversion -->
{{hostname | upper}}
{{alert_type | lower}}
{{description | title}}
<!-- String operations -->
{% if "DC" in hostname %}
Domain Controller Detected
{% endif %}
<!-- Clean and format data -->
Clean IP: {{ip_address | trim | replace(' ', '')}}
Formatted Name: {{alert_name | truncate(50) | title}}Problem: UndefinedError: 'dict object' has no attribute 'fieldname'
Solution: Use default filters and check data structure
<!-- Instead of -->
{{vars.input.records[0].nonexistent_field}}

<!-- Use -->
{{vars.input.records[0].nonexistent_field | default('Not Available')}}Problem: Comparing strings to numbers
Solution: Convert types explicitly
<!-- Convert to string for comparison -->
{% if port | string == '80' %}

<!-- Convert to integer for math -->
{% if severity_score | int > 7 %}Problem: Trying to access list items that don’t exist
Solution: Check list length first
{% if vars.input.records and vars.input.records | length > 0 %}
{{vars.input.records[0].name}}
{% endif %}Create temporary Set Variable steps to test your Jinja2 expressions:
Name: test_output
Value: {{your_complex_jinja_expression}}Start simple and add complexity:
<!-- Step 1: Basic access -->
{{vars.input.records[0].name}}

<!-- Step 2: Add conditions -->
{% if vars.input.records[0].name %}{{vars.input.records[0].name}}{% endif %}

<!-- Step 3: Add formatting -->
Alert: {{vars.input.records[0].name | upper | truncate(30)}}Always check the ENV view in execution history to understand available data structure.
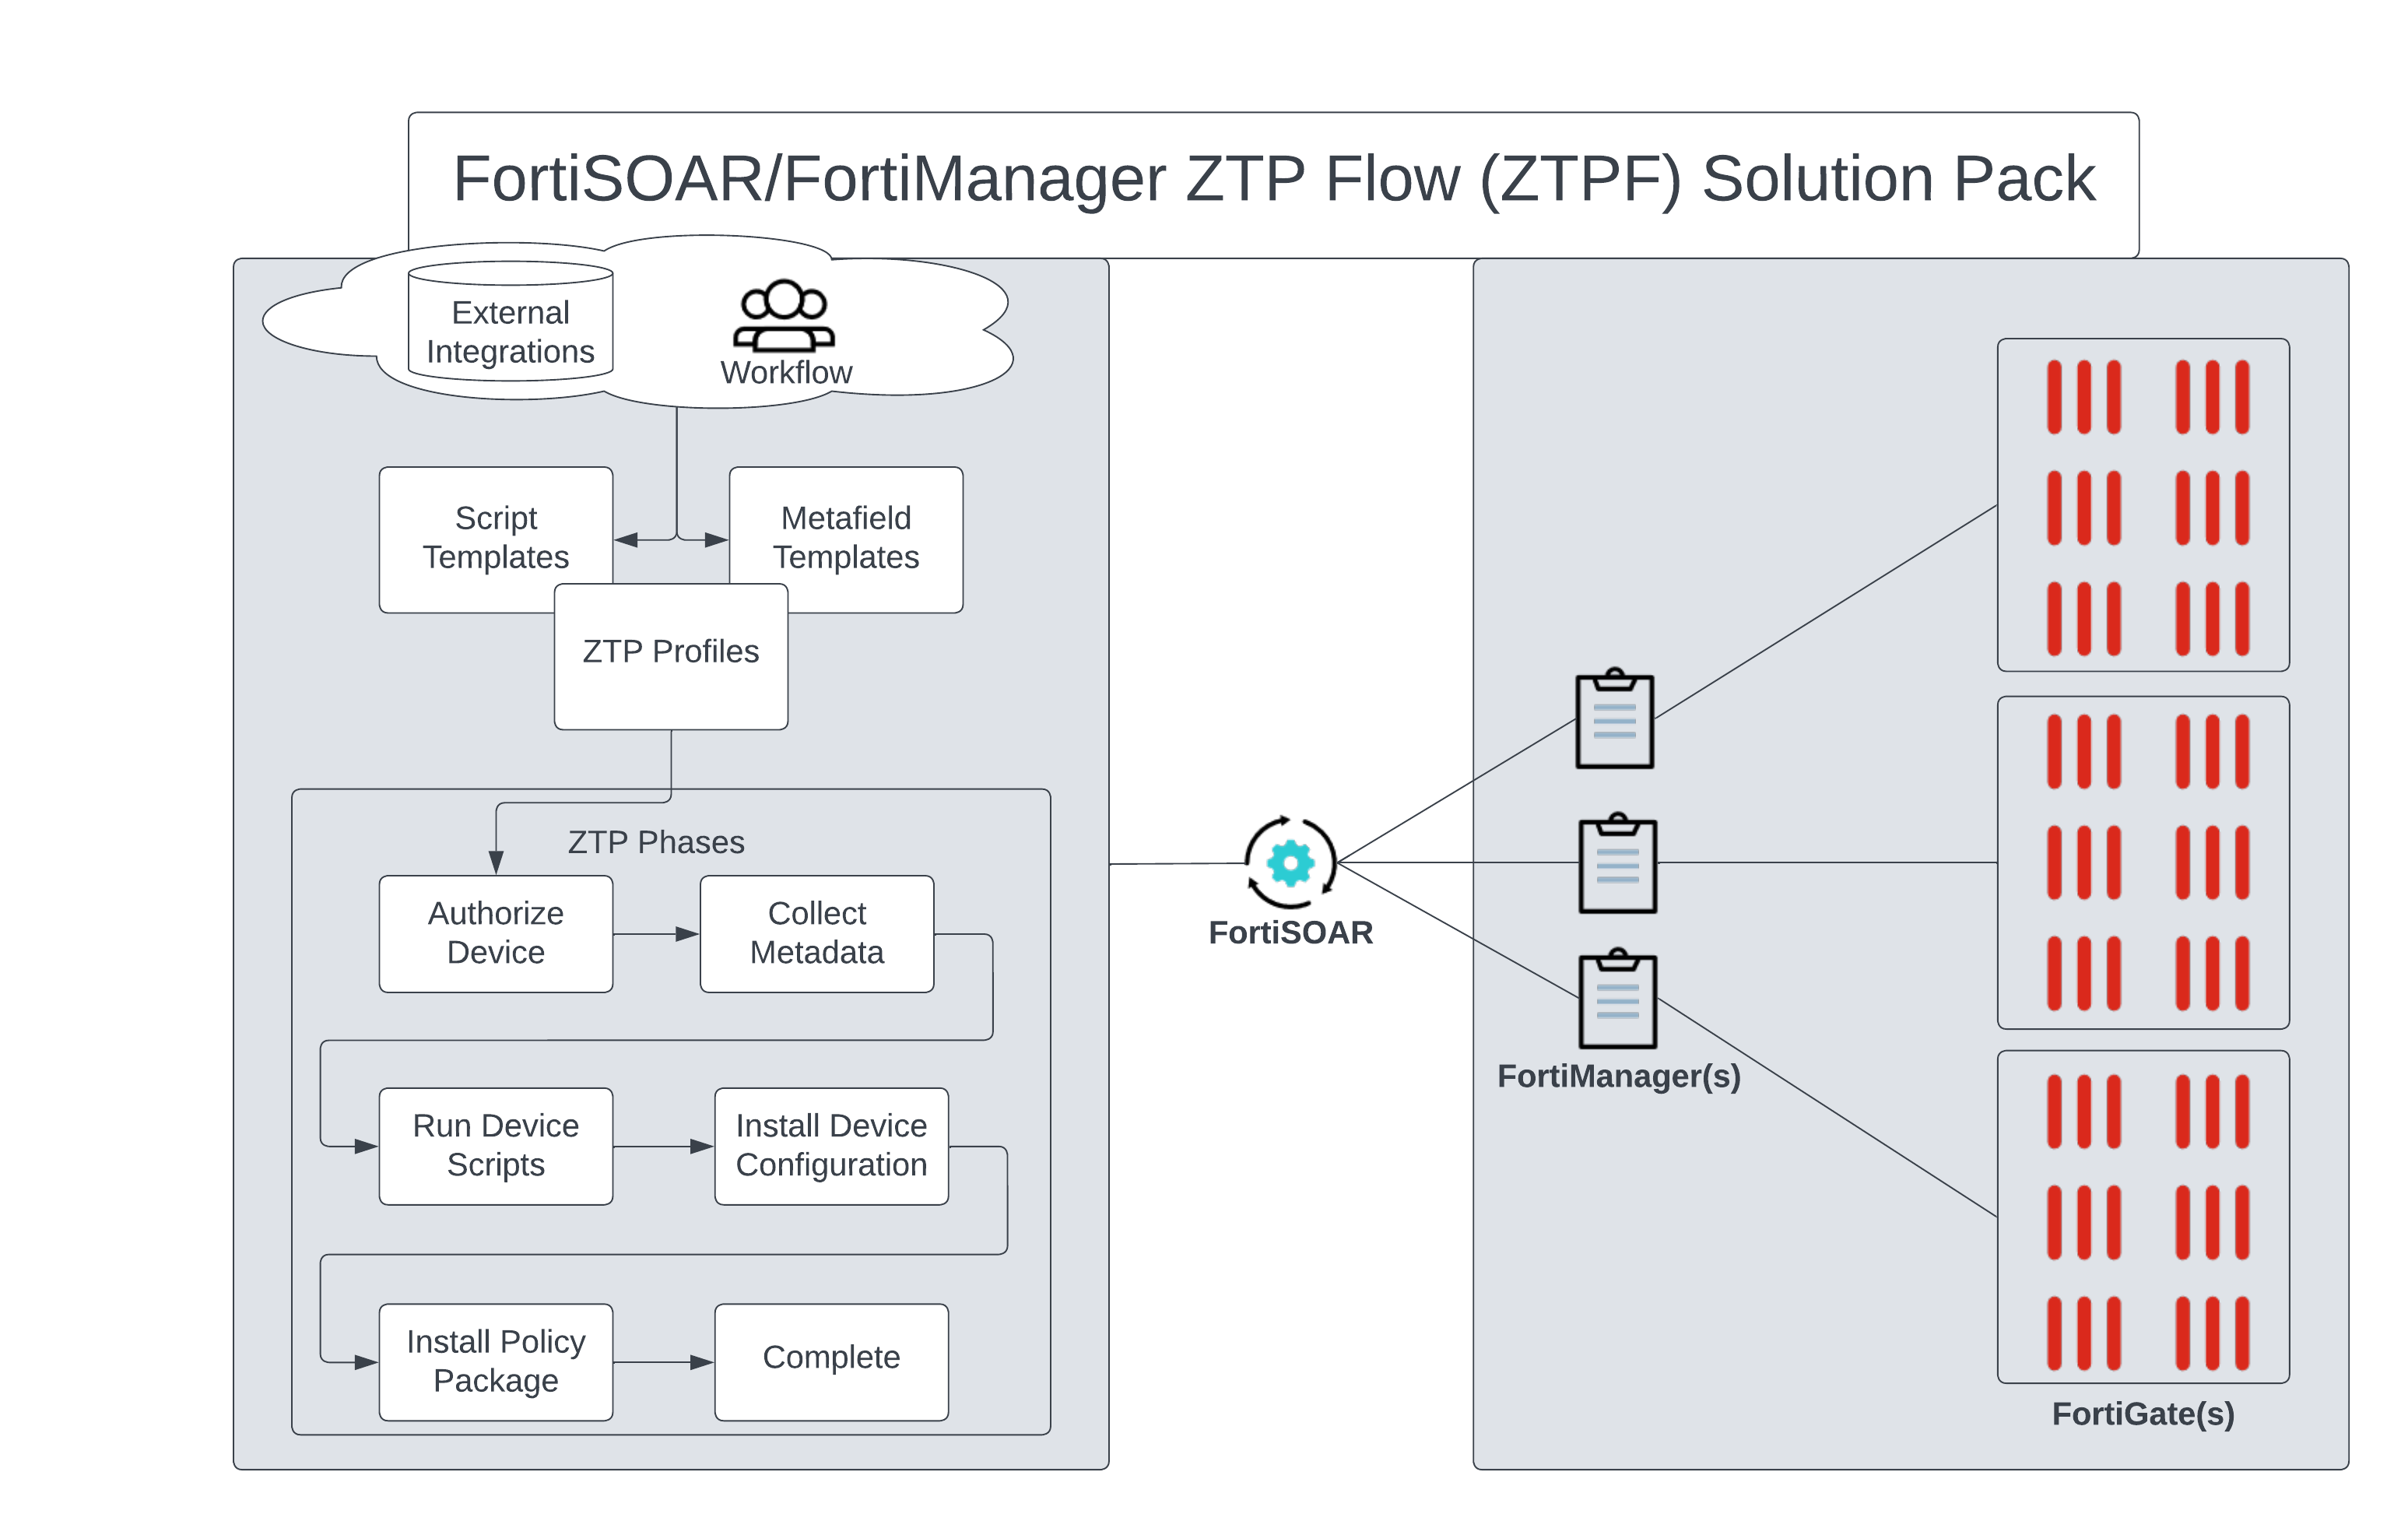
Zero Touch Provisioning (ZTP) is an automated deployment and configuration technique used by Fortinet’s FortiGate firewalls and FortiManager central management platform. ZTP streamlines network security infrastructure deployment, allowing for automatic provisioning and configuration of new devices upon network connection, reducing manual setup, and minimizing misconfiguration risks. FortiManager acts as a central control point, storing configuration templates, policies, and security profiles for FortiGate devices, which ZTP then uses to maintain consistent security policies and simplify network security device deployment and management. This enhances network security while saving time and effort on setup and maintenance.
Estimated: 45 Minutes
Now that you have a foundational grasp of Zero Touch Provisioning (ZTP) and are familiar with the purpose and location of the FortiSOAR ZTP modules, let’s delve into a more detailed discussion of the ZTP Phases. When implementing ZTP, there are distinct categories of tasks that must be accomplished. These tasks are organized into specific phases.
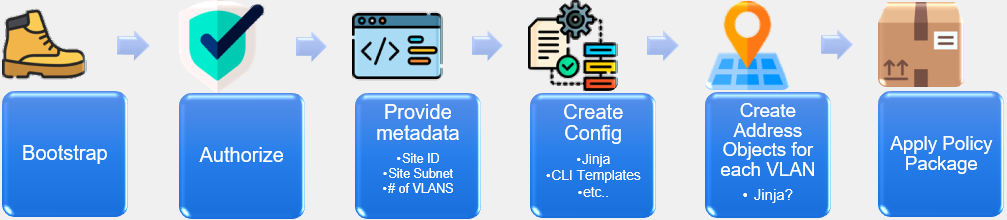
The ZTP Phases within FortiSOAR outline what steps a ZTP Profile will take when provisioning a device. The ZTP Phases are as follows:
Authorization
Device Metadata
Device Groups
Execution of Linked Scripts
Installation of Device Configuration
Installation of Policy Package
Completion
These ZTP phases are essential components of the ZTP framework, ensuring a well-structured and methodical approach to device provisioning and configuration management.
In this section we’ll explore the FortiManager ZTP modules on the system. Click around and checkout the record types inside the group. Feel free to click:  to see what fields are used for records of the different modules. You can create records and delete records to just get a feel for the system if you like.
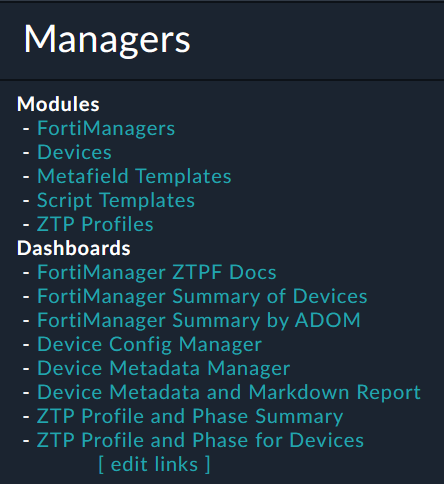
The FortiManager Group is where we will find records that are used for FortiManager Zero Touch Provisioning. We have provided a breakdown of what each module’s purpose is.
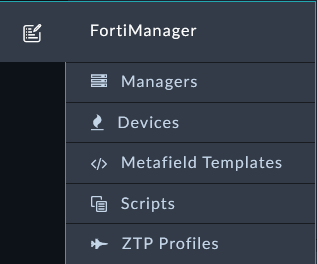
| Module Name | Description |
|---|---|
| Managers | Manager records define the FortiManagers, and the current firmware and status, used in your solution. Use this module to start the integration and/or simply report on the current status of your FortiManagers. |
| Devices | Devices are synchronized from the FortiManager and stored in FortiSOAR. Then automation can occur on one or more devices based on operations and workflow needs. Once created in FortiSOAR they are not removed to preserve the last known status of the Device record even if the device has been removed, or moved, from your FortiManager. |
| Metafield Templates | Managing metafields is crucial to the success of any network deployment and provisioning. Metafield Templates can be used to prompt required users to respond to unknown, but required, fields before deployment. Templates can be used to integrate external systems and retrieve key data requirements before deployment. Templates can be customized to create dynamic metadata based on a wide range of advanced and complex requirements. Metadata inside FortiSOAR can be exported to FortiManager to be used by already existing solutions with minimal effort. |
| Script Templates | Scripts in FortiSOAR for this Solution Pack can be used for creating customized FortiManager CLI, Device DB, Policy DB, and/or TCL Scripts per device. Scripts in FortiSOAR can also maintain and create Provisioning CLI Templates in FortiManager such as when new ADOMs are created and need to be setup with Templates. Device reporting scripts can also be used to create a custom dashboard with user defined content. |
| ZTP Profiles | The ZTP Profiles module describes how to handle the provisioning of each device maintained by the respective FortiManager. As a device shows up in the FortiManager Device DB, unauthorized or modeled, when ZTP Profiles are assigned to those devices the defined device templates and provisioning steps are applied and reported per device. ZTP Profiles can be assigned on demand or automatically assigned when devices are created in FortiManager regardless of how the devices were created. |
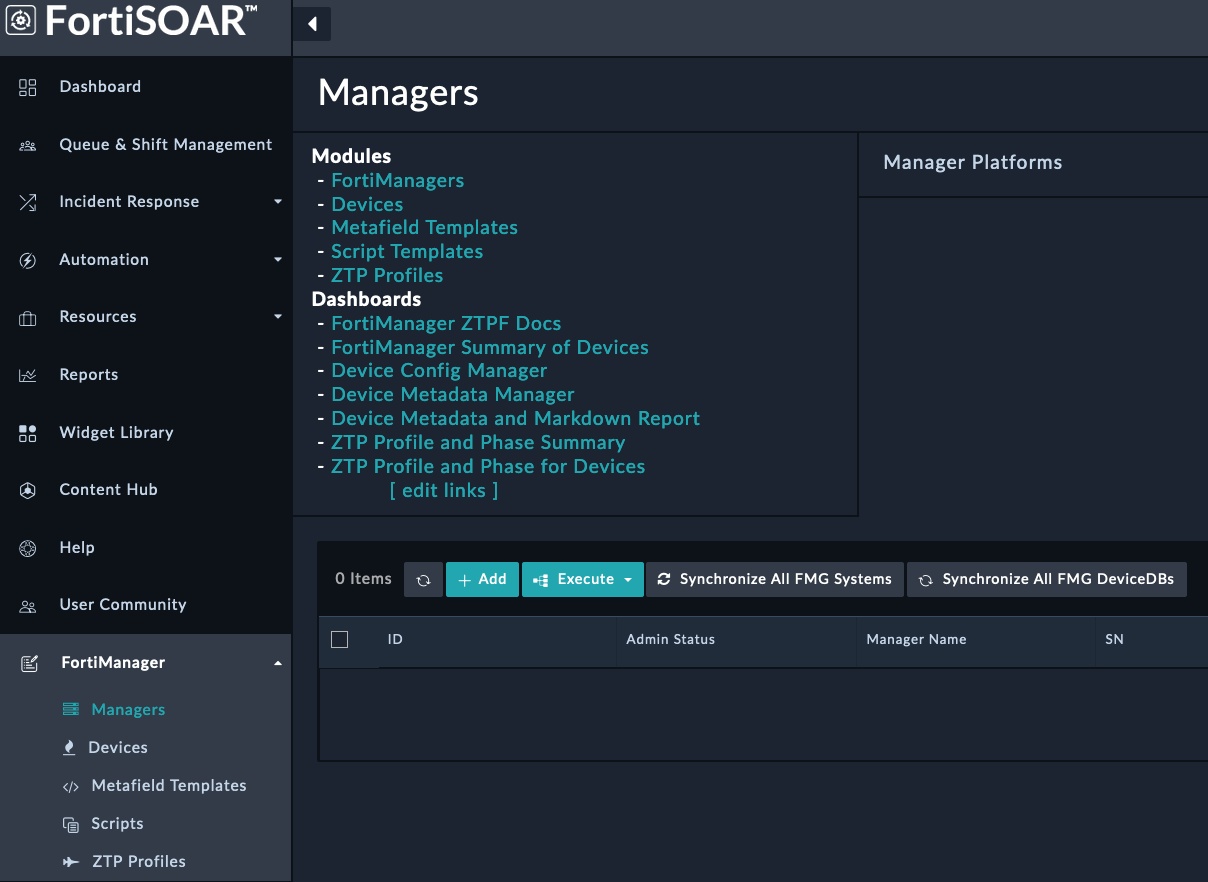
On the Managers Module you will see a clickable navigation menu that can take you to different modules or Dashboards. The navigation is there to reduce the number of clicks to navigate to different modules. The navigation menu is also available on the other modules.
This guide walks you through the complete setup process for the ZTP (Zero Touch Provisioning) Solution Pack, including installation, configuration, and user setup.
Before beginning, ensure you have administrative access to both FortiSOAR and FortiManager systems.
Navigate to the Content Hub by clicking the Content Hub tab in the left navigation pane
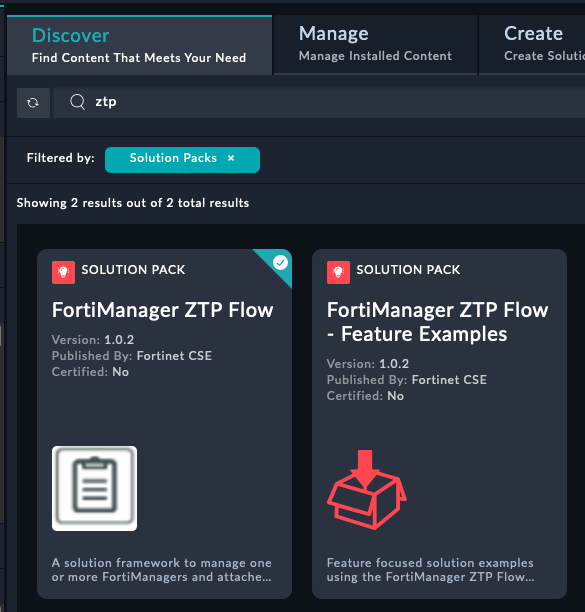
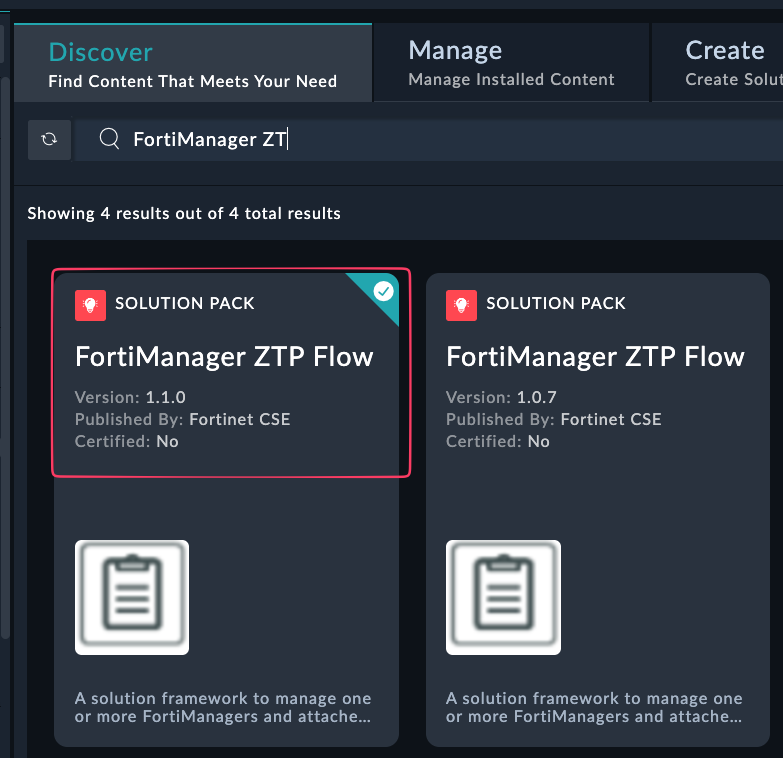
Search for FortiManager ZTP Flow in the Content Hub
If you already see that FortiManager ZTP is installed, then the steps on this page have already been completed for you. Do not install any ZTP Solution Packs. The rest of this page is more informational on the typical process. Example if already installed:
Warning
Open the Solution Pack and click the Install button
Wait for the installation to complete
Important configuration steps are required before the ZTP Solution Pack can be used effectively.
Ensure Connectors are not filtered out in the Content Hub view
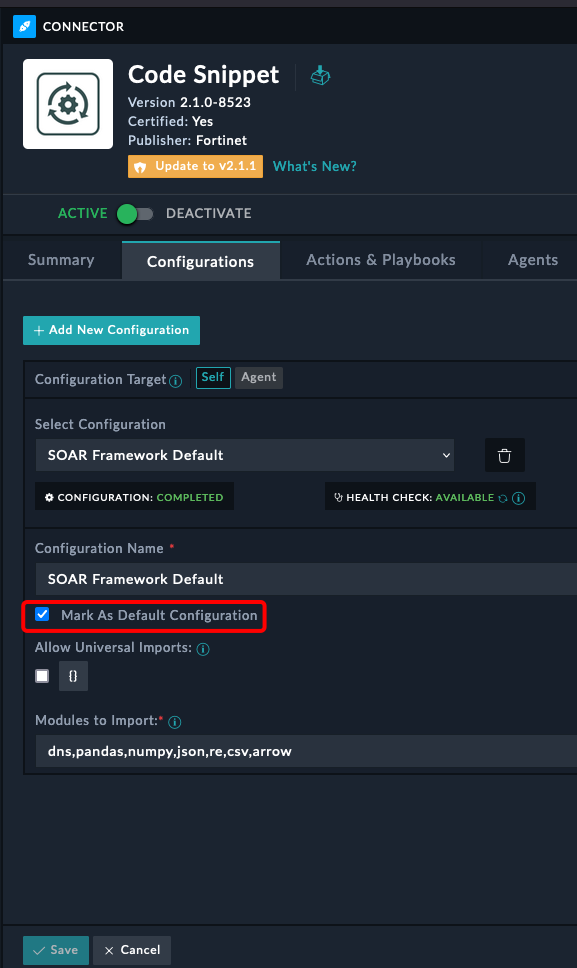
Search for Code Snippet in the Content Hub
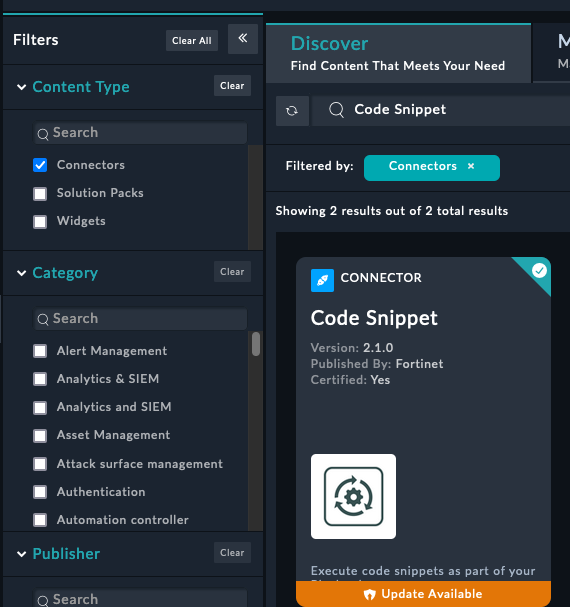
Open the connector and check the Mark as Default Configuration checkbox, if it’s not already set.
Navigate to System Settings by clicking the gear icon in the top right corner of the FortiSOAR UI.

The configuration steps vary depending on your FSR version:
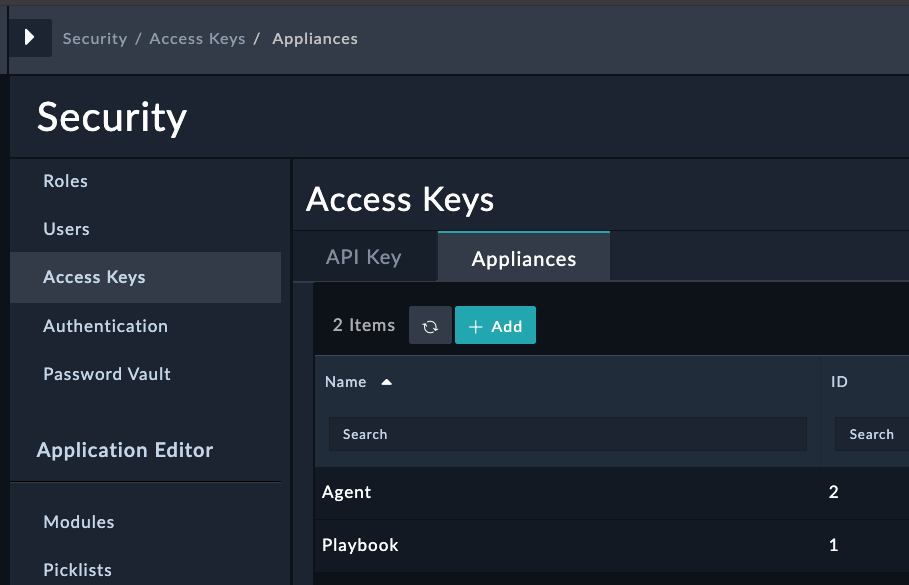
In the left sidebar, scroll down and click Access Keys
Select the Appliances tab
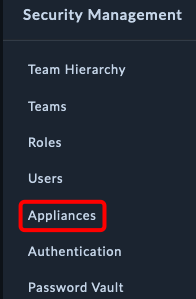
In the left sidebar, scroll down and click Appliances
Note: These steps apply to all FSR versions after accessing the appropriate section above.
Click on the Playbook record (click the record name, not the checkbox)
In the Roles table, check the box for FortiManager-Playbook-Appliance
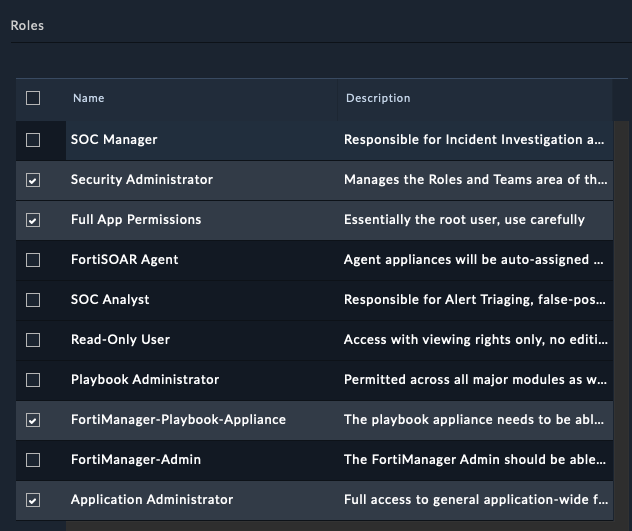
Click Save at the bottom of the page
In the left sidebar, scroll down and click Users
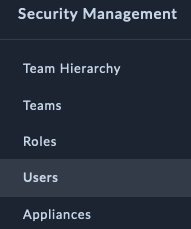
Click the CS Admin record (click the record name, not the checkbox)
In the Roles table, check the box for “FortiManager-Admin”
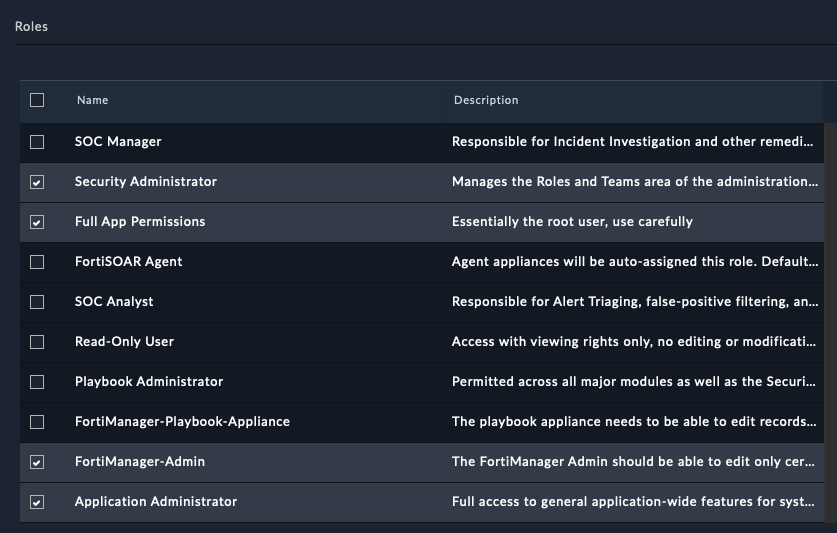
Click Save at the bottom
Log out of the current FortiSOAR session
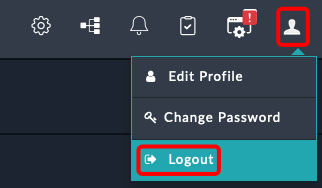
Log back into FortiSOAR using the CS Admin credentials:
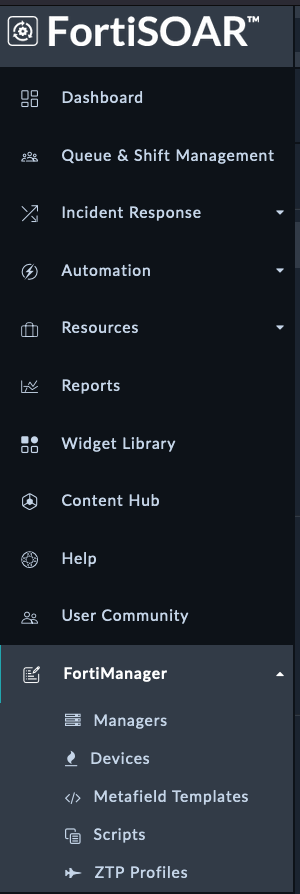
csadmin$3curityFabricVerify the setup by confirming you can see the FortiManager section in the bottom left navigation pane
Access the FortiManager UI using the IP address from your Evoke instance
Log in with the following credentials:
admin$3curityFabricOpen the integrated SSH terminal to proceed with API account configuration

Run the following command to create a new API Admin (Use the copy button below)
config system admin user
edit "fortisoar"
set password fortinet
set profileid "Super_User"
set avatar "/9j/4AAQSkZJRgABAQAAAQABAAD/2wBDAAMCAgMCAgMDAwMEAwMEBQgFBQQEBQoHBwYIDAoMDAsKCwsNDhIQDQ4RDgsLEBYQERMUFRUVDA8XGBYUGBIUFRT/2wBDAQMEBAUEBQkFBQkUDQsNFBQUFBQUFBQUFBQUFBQUFBQUFBQUFBQUFBQUFBQUFBQUFBQUFBQUFBQUFBQUFBQUFBT/wAARCABAAEADAREAAhEBAxEB/8QAHwAAAQUBAQEBAQEAAAAAAAAAAAECAwQFBgcICQoL/8QAtRAAAgEDAwIEAwUFBAQAAAF9AQIDAAQRBRIhMUEGE1FhByJxFDKBkaEII0KxwRVS0fAkM2JyggkKFhcYGRolJicoKSo0NTY3ODk6Q0RFRkdISUpTVFVWV1hZWmNkZWZnaGlqc3R1dnd4eXqDhIWGh4iJipKTlJWWl5iZmqKjpKWmp6ipqrKztLW2t7i5usLDxMXGx8jJytLT1NXW19jZ2uHi4+Tl5ufo6erx8vP09fb3+Pn6/8QAHwEAAwEBAQEBAQEBAQAAAAAAAAECAwQFBgcICQoL/8QAtREAAgECBAQDBAcFBAQAAQJ3AAECAxEEBSExBhJBUQdhcRMiMoEIFEKRobHBCSMzUvAVYnLRChYkNOEl8RcYGRomJygpKjU2Nzg5OkNERUZHSElKU1RVVldYWVpjZGVmZ2hpanN0dXZ3eHl6goOEhYaHiImKkpOUlZaXmJmaoqOkpaanqKmqsrO0tba3uLm6wsPExcbHyMnK0tPU1dbX2Nna4uPk5ebn6Onq8vP09fb3+Pn6/9oADAMBAAIRAxEAPwD89dO0661e/t7Kyt5Lu8uHEUUEKlnkYnAUAdSTXtHlH01afsBeKNN0+1m8Z+NfBvgG8uUEi6breqot0qkZG5Bkisfarormvs31diT/AIYZs/8AouHw3/8ABp/9al7X+6w9n5oP+GGbP/ouHw3/APBp/wDWo9r/AHWHs/NB/wAMM2f/AEXD4b/+DT/61Htf7rD2fmg/4YZs/wDouHw3/wDBp/8AWo9r/dYez80JJ+wB4k1i2uP+EO8eeCfHGowoZP7M0nVkNzIAMnYjYJo9slurB7N9GfM2s6NfeHdVu9M1O0lsdQtJGhntp0KvG4OCCDW6d9UZbH0Z/wAE9dOtZfj/AC6zcwJcyeHtCv8AWLZJBkedGgCH8C+fwrGt8NjWl8Vz598W+LNV8ceI9Q13WryW/wBTv5mnnnmcszMxyevb2rZJJWRk3fVmRTA634W/DLWfi7420zwtoSI2pai5igMuRHv2kgMwBxnGM1MpKKuxpOTsjG8T+GNV8Ga/faJrdjNpuq2MrQ3FrOu143HUEU001dCatozLpgaGga9qHhfWbPVdLu5rHULOVZoLiByjo6nIII9xSavow2PpH9v+KLU/iN4O8WeRHBf+KPCthql95S7Q9wybXfA9SuaxpaJrsa1N0w/4J7f8lY8Y/wDYmap/KOit8K9Qpbs+Xq3Mj7H/AGRf2OdB8X+DLv4ufF3UToHw108s0UTt5bX5U4J3ddmRt45Y8CuapUafLHc2hBNc0tj2fwd/wUd+GfgPx7pHhz4e/DKz0DwRHKYp9SFsTezoFOPLjQbtzHAG4sTnnFZOjJq8nqaKqk7JaHz34g/ac8MfFb9rqHx38V/CG/wlDvtG0WGACVYtjLG0w4MjKWDHvxgdBWypuMOWL1MnNSneSOk/a1/Y48OaH4FtvjB8GtQ/tz4c3gD3NqjmR7AscZB67MnBDcqevsqdRt8s9ypwVuaOx8Y10mB9Sft1/wCu+Dn/AGIun/8As1YUuvqbVOnoM/4J7f8AJWPGP/Ymap/KOit8K9RUt2fPPgjw4/jDxloWhIxVtSvoLPcOq+Y4XP4ZzWrdlczSu7H3F/wVB8bTeHdT8CfBPw9m10DQ9Lgmks7bhZZTlIlIHXCrnHq+a5qCvebN6ztaKPdP2f8A9n74S/s8fAHwh8Vfip4R/wCEa8WaGGubi7vpJHmEzSERnylbazEbdqkEqfTrWU5ynJxi9DSMYxipSRo/GH4I/Br9qH4I+Nvip8OvCg8UeLNWtD9muLSWSGf7TGQB+6Y7UcY5G3LDrnNKMpwkoyeg5RjOLlE+c/8AgmD44mufGfjD4KeJ4nufDviHT5/M065ziKZBtkAB+6WUkHHdQe1bV1opoyovVxZ8WfEfwq3gX4g+JfDjtvfSdRuLEt6+XIyf0rpi7pMwas7H0D+3X/rvg5/2Iun/APs1ZUuvqa1OnoM/4J7f8lY8Y/8AYmap/KOit8K9RUt2fOXhe51K08SaXNo0skGrpdRm0liOHWbcNhHvnFbPbUyXkfWv7WH7IXxP+GttH8SvGvxH03xJcOsRW61O9db13CgrFGkmS5X0BwAK56dSMvdSNpwkvebPr74Q/Fb4c/tf/s4eF/h38U/HFhrHjPXwyzWltKLe9WeNyyHaBgOABg4w3YGueUZU5OUVobxcZxtJ6l3x34++F37GP7P/AIy+Hvw78b2Gi+NNHtWngtr6UT3j3UhBB2kYZjkcAYUckYFJKVSSlJaDbjTi0mfN/wDwTe+C3jCH44j4q+KLKa08OHRrjVE1qXH2e5MvBw44DL8xZeCMcgVtWkuXlRlSi+bmZ8V/GHxPB41+LHjLxBbArbaprF3eRg9lkmZh+hrqirRSOeTu2z3T9uv/AF3wc/7EXT//AGasqXX1NanT0Gf8E9v+SseMf+xM1T+UdFb4V6ipbs+cvDHiG68JeItN1qyETXun3CXMHnJvQSIcqSO+CAa2aurGSdnc+/vgN+1P4T/an+Ht98IP2gdRVdRupnm0nxNPtj2ysSVUt0R1LELngj5T2rknTdN88DpjNTXLM80+IX/BNf40/DLX4tT8ChPF+nxSCay1fQ7xILiPByrbWZWDe6Fh71arQkrSJdKS2IfB3/BN/wCO3xS1m61TxhHH4YikzLcat4jv1mmkbHdVZnJ6ctge9DrQjohKlN7l74eft0a/+zX8H9U+DU/hbTPElzYXl5ZveXd2ZbUwOSGjCp94ZLnO7BDCk6SnLnuNVHBctj491nUU1bVbu9jtILBJ5GkW1tVIiiBP3VBJOB9a6UYH0v8At1/674Of9iLp/wD7NWNLr6m1Tp6Gb/wT/wBd0/Tf2gV0rUbpLKLxFo97okc8hCqssyDywSemWQD8aKy926FTfvHifxF+HWv/AAs8W6h4d8R6dcabqNnK0TJPGVDgHAdSeqnqCK1jJSV0ZtOLszmaoR6b4F/aY+Kfw1tFtPDnjvW9Ms14FtHdsYx9FOQKzcIy3RSlJbMd43/ad+K3xGtGtPEPj3XNRtGGGt3u2WMj3UYFChFbIHOT3Z5j1rQk3PBXgjW/iH4kstC8Pabc6pqd3IsccFtGXPJxk46AdyeBUtqKuxpN6I+gP2/NQs7f4n+GfCVrdRXs/hHw3Y6LeSwncv2hEzIoPfBOKypbN9zSpvbsfMsE8ltMksTtFKjBldDgqR0INbmR9HeHf+CgPxb0bSLbTtQu9H8VQ2yhIZPEGmJcyqoGAN/DHHuTWDox6GqqSNP/AIeJfEX/AKFrwN/4IR/8XR7GPdh7Rh/w8S+Iv/QteBv/AAQj/wCLo9jHuw9ow/4eJfEX/oWvA3/ghH/xdHsY92HtGH/DxL4i/wDQteBv/BCP/i6PYx7sPaMo61/wUI+LmoabcWelz6J4VFwpSSfQdKjt5iD1w53EfUYNHsY9Q9pI+b7y8n1C7murqZ7i5mcySSysWZ2JySSepNbGR//Z"
set rpc-permit read-write
next
end
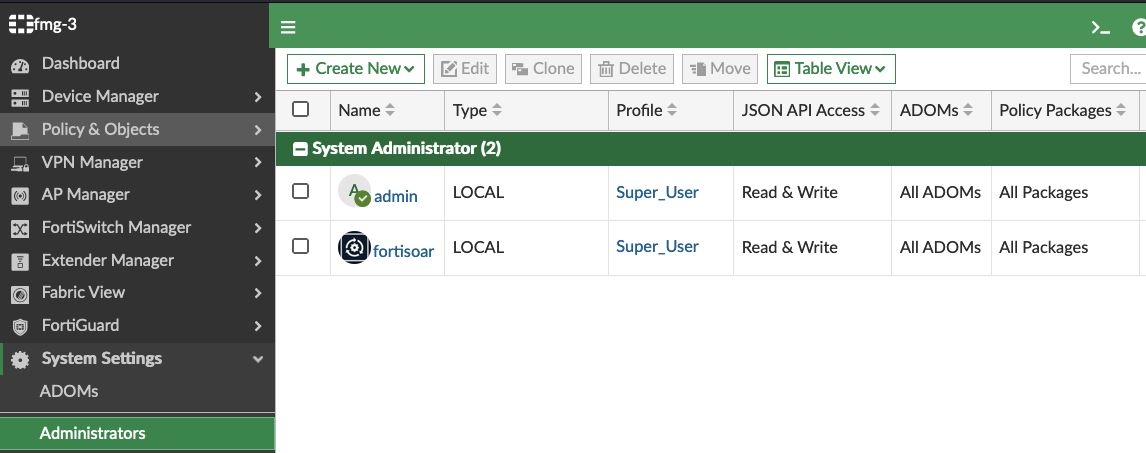
endVerify the new user was created by navigating to System Settings > Administrators and checking for the new user
We will begin configuring FortiSOAR to connect to FortiManager, which allows us to manage FortiManager.
Navigate to FortiManager > Managers If you already see a Manager Record, you don’t need to create a new one. You can skip to here
Note
Click the
button to add a new record.
Enter the following information:
FortiManager10.100.88.10fortisoarfortinet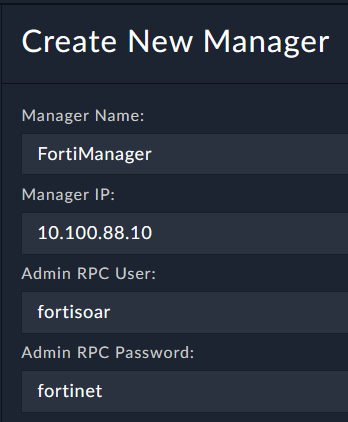
Click Save.
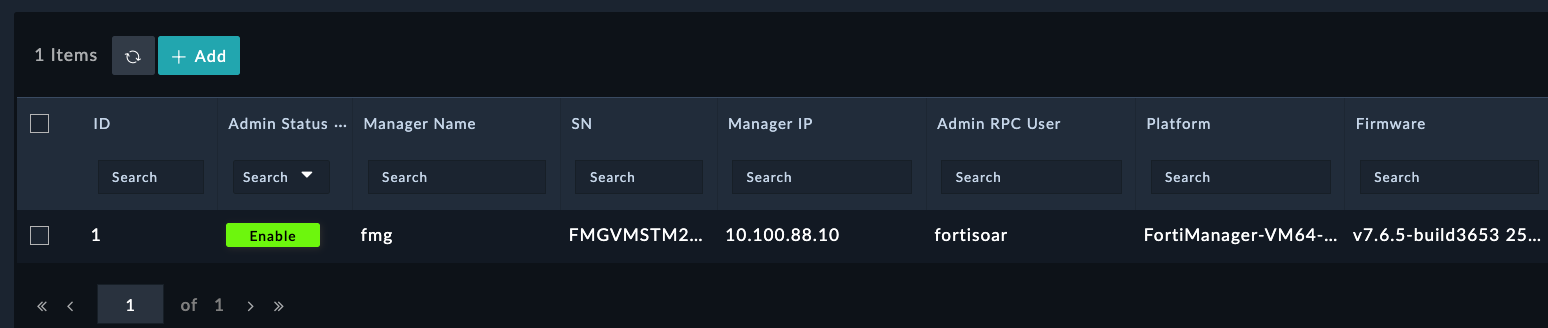
You will now see the FortiManager record populated with information from the FortiManager API. FortiSOAR automatically created the connector configuration for us and retrieved details about the device
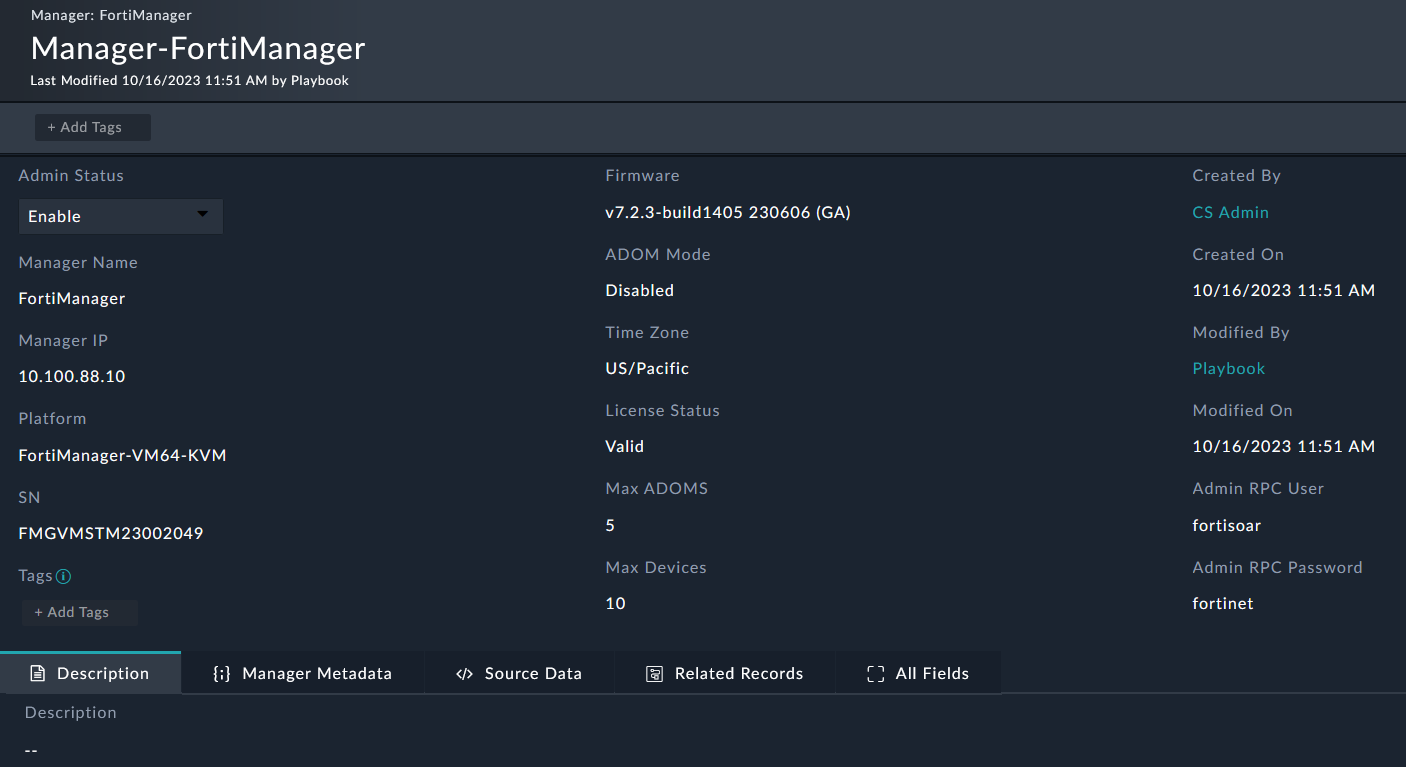
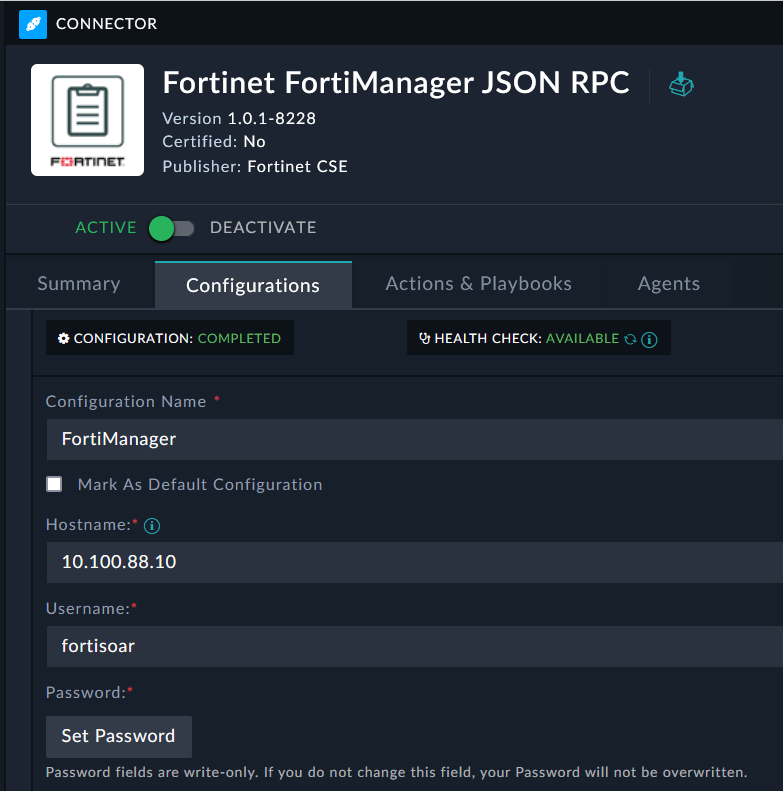
The health check is successful because the fortisoar user was already present on FortiManager. Normally you would need to create an api user with rest api permissions
Investigate the playbook that triggered when we created the FortiManager record. What did it do?
In this section we’ll create a ZTP profile that will be used to configure the FortiGate when it shows up in FortiManager.
Navigate to FortiManager > ZTP Profiles and click the
button to add a new record.
Set the following fields (leave the rest as default):
Branch ZTP ProfileBasic ZTP Profile for SE WorkshopManualDevice NameBranch[1-2]rootBranch_DevicesGolden_BranchThis ZTP profile is saying that it will be manually assigned to devices that have a name that matches the regex Branch[1-2] . It will move those matched devices to the root adom, add the devices to the device group Branch_Devices and install the policy package Golden_Branch to the device automatically.
You will create a Policy Package with a policy later on. But if you didn’t, FortiSOAR would automatically create an empty Policy Package for you.
Click Save.
Congrats! You made your first ZTP profile. But usually Zero touch configurations need more configuration than just a policy package and device group, so lets see what it takes to set that up.
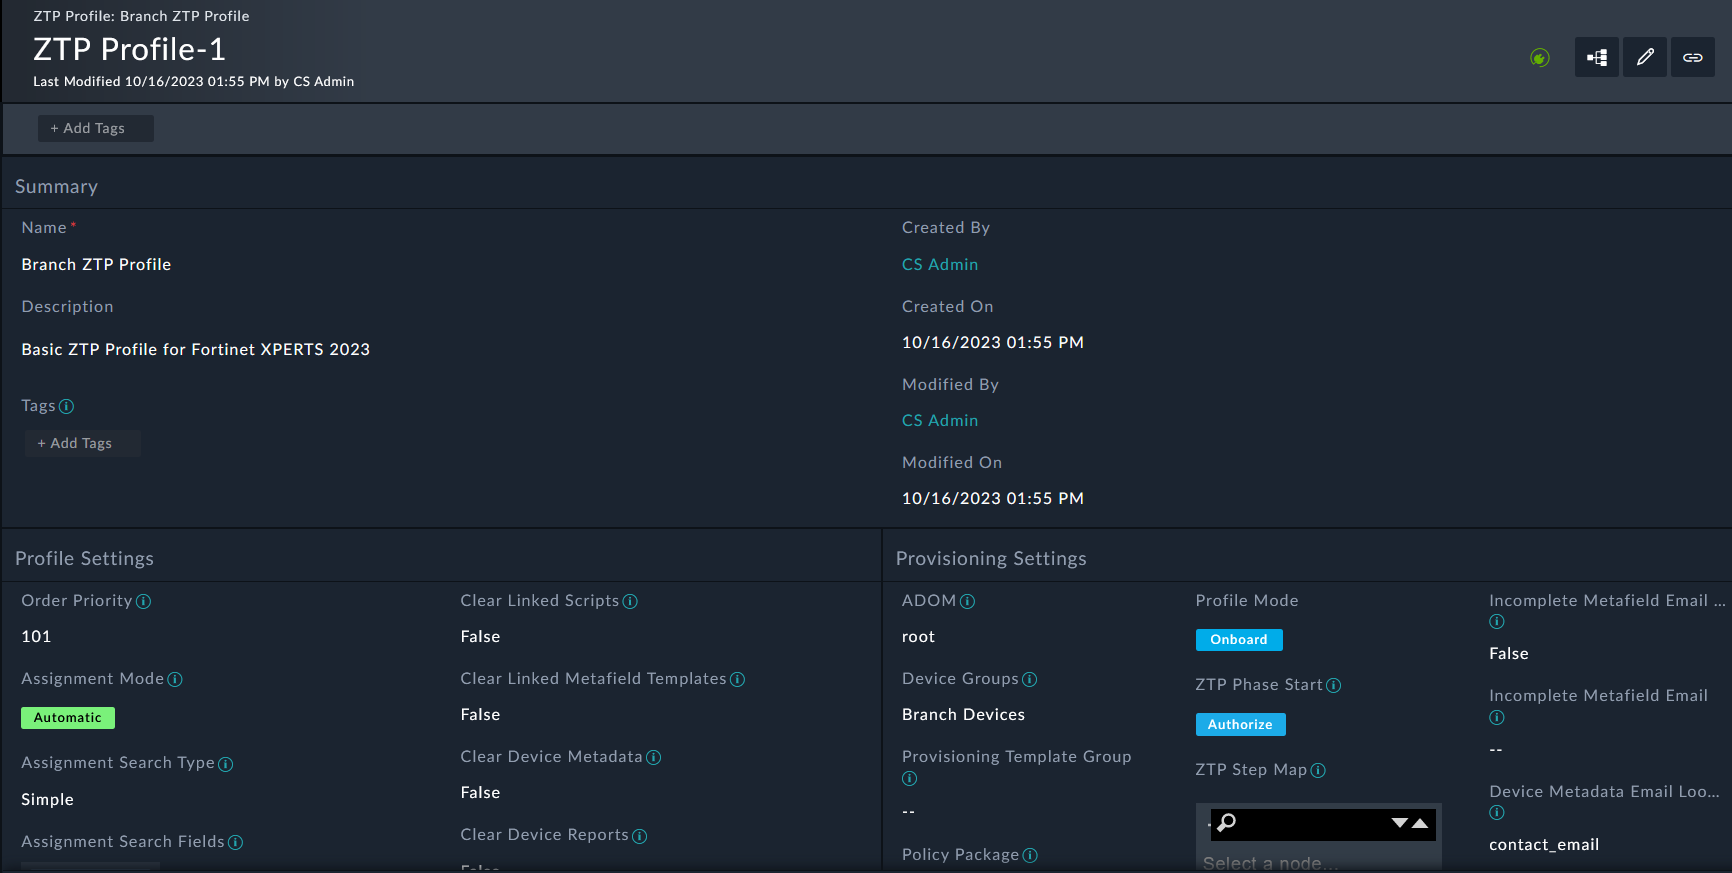
Keep in mind, we set the ZTP profile mode to Manual. We will change this later on.
Scroll down to the Related Records tab, click the Metafield Templates sub-tab, and click the
button on the Metafield Template section add a new record.
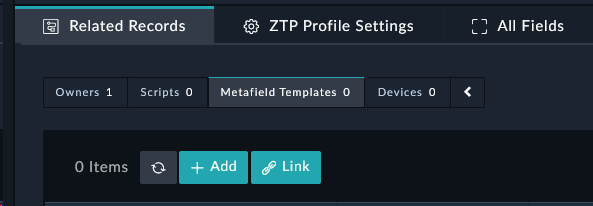
Set the following fields on the popup (leave the rest as default):
Branch ZTP VariablesMetafields for SE Workshop{
"contact_email": "socuser1@financial.local",
"admin_user_name": "se_admin",
"admin_timeout": "120",
"loopback0_ip": ""
}Click Create.
You may need to click the refresh button underneath the metafield section if you don’t see the new template there. The refresh only affects visibility, not functionality of the template.
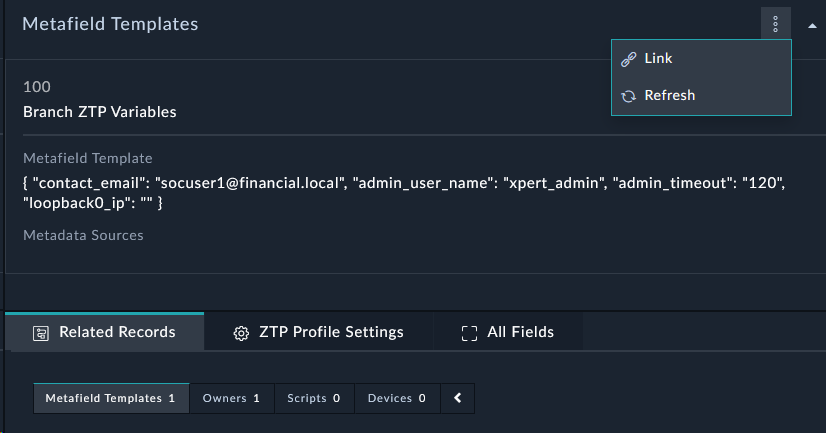
You will now see a new metafield template added and linked to the ZTP profile. This Metafield template will be used to populate the metafields for the Script Templates, or be used for overrides on the ZTP profile.
The metafields are used to pass variables to the scripts. The metafields are referenced in the scripts using the following syntax: {{devmeta.metafield_name}}
Scroll down to the Related Records tab, click the Scripts sub-tab, and click the
button on the Scripts section add a new record.
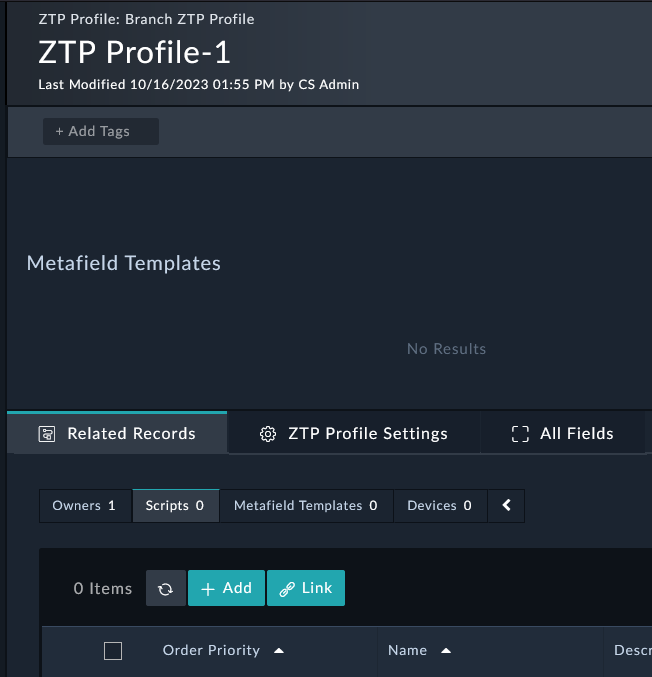
Set the following fields on the popup (leave the rest as default):
Order Priority: 90
Name: Purge FortiGate config
Description: This script will purge FortiGate config for SE Workshop
Type: Remote CLI
Script:
config firewall policy
    purge
end
config system sdwan
    config service
        purge
    end
    config neighbor
        purge
    end
    config health-check
        purge
    end
    config members
        purge
    end
    config zone
        purge
    end
    set status disable
end
config vpn ipsec phase2-interface
    purge
end
config vpn ipsec phase1-interface
    purge
end
config firewall address
    purge
end
Click Create.
The order priority is used to determine the order in which the scripts are executed. The lower the number, the higher the priority. The purge script needs to be executed before the other scripts, so we set the order priority to 90.
Scroll down to the Related Records tab, click the Scripts sub-tab, and click the
button on the Scripts section add a new record.
Set the following fields on the popup (leave the rest as default):
Name: Configure Admin User and Loopback interface
Description: This script will create an admin user on a FortiGate for SE Workshop
Type: Remote CLI
Script:
config system global
    set admintimeout {{devmeta.admin_timeout}}
end
config system admin
    edit "{{devmeta.admin_user_name}}"
        set accprofile "super_admin"
        set vdom "root"
        set password fortinet4A!!
    next
end
config system interface
    edit "Loopback0"
        set vdom "root"
        set ip {{devmeta.loopback0_ip}} 255.255.255.255
        set allowaccess ping
        set type loopback
        set description "Loopback0 for SE Workshop"
    next
end
Click Create.
You will now see 2 scripts added and linked to the ZTP profile. This script will be executed on the FortiGate along with other scripts you create based on the order priority.
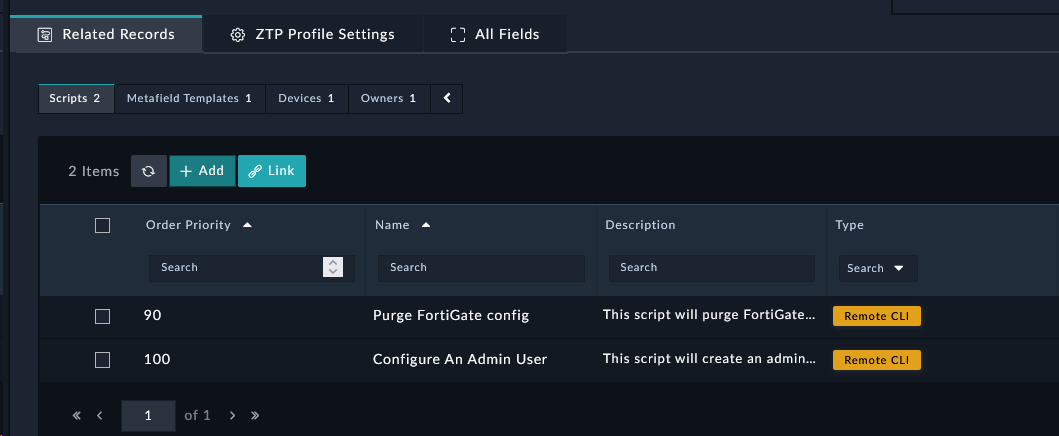
In this section we’ll onboard a FortiGate manually so that it checks into FortiManager. Onboarding a device to FortiManager can be done automatically using various methods (DHCP option, FortiZTP, FortiDeploy SKU), but we’ll do it manually for this lab.
Do not Authorize Branch1 during this process. We will do that later.
$3curityFabric10.100.88.10 in the IP Address field.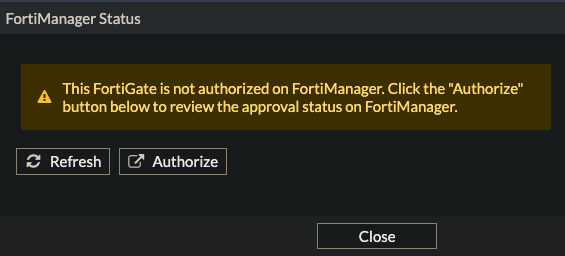
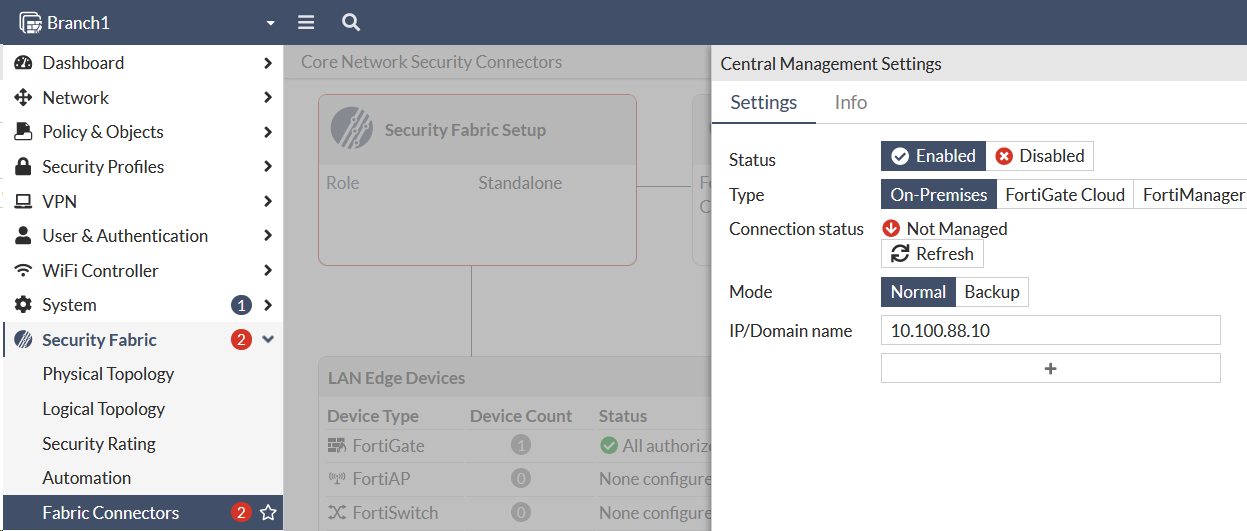
$3curityFabricDo not Authorize Branch1 here. Our ZTP profile will do this for us.
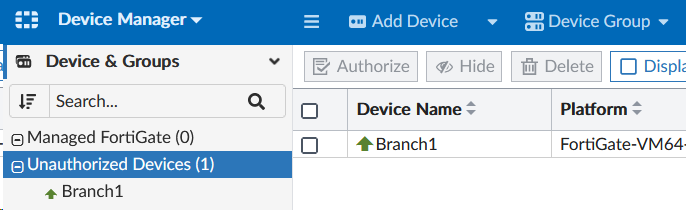
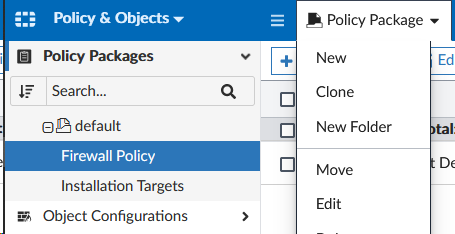
Golden_Branch for the Name and click OK at the bottom of the page.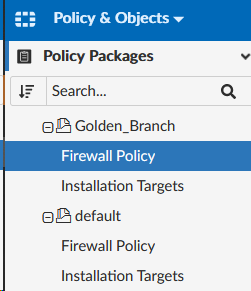
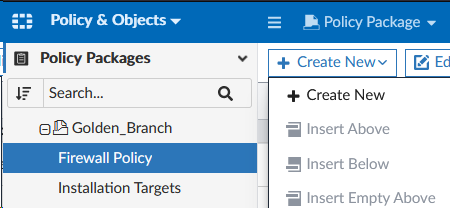
Allow port2 to Internetport2port1RFC1918-10allHTTPSAcceptEnablePolicy CreationYou now have your first policy!
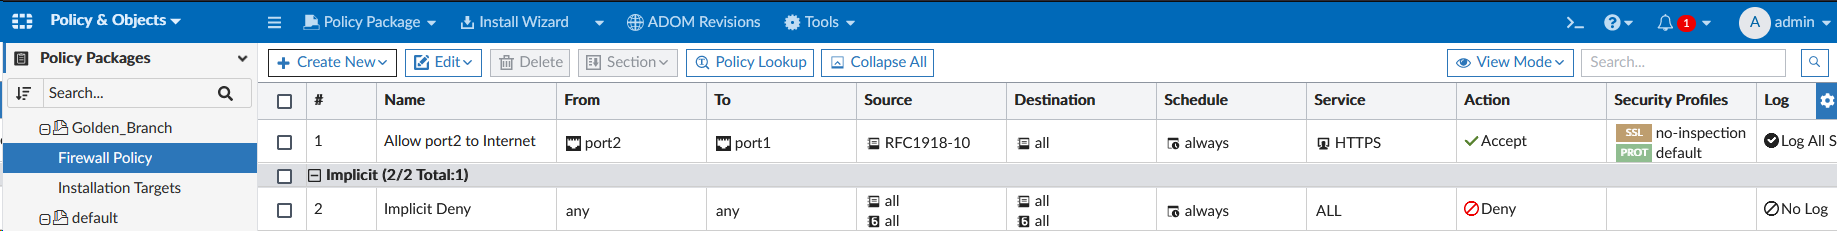
We’re now ready to assign a profile to the FortiGate. Now you might be thinking “Wait, I thought we were doing ZTP?”. We are, but there are some cases where you may need to restart the ZTP process. For example, if you need to change the ZTP profile, or if you need to re-onboard the device. In this case, we’ll assign the profile manually.
$3curityFabric
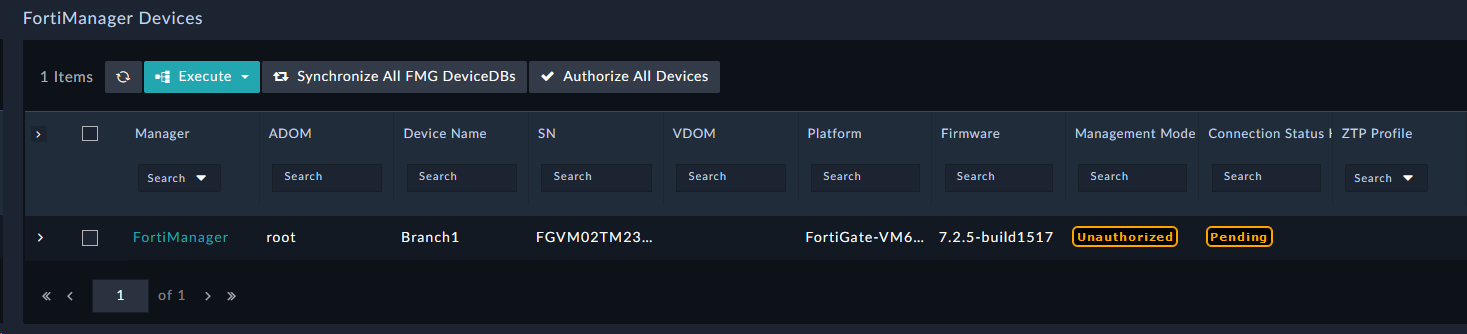
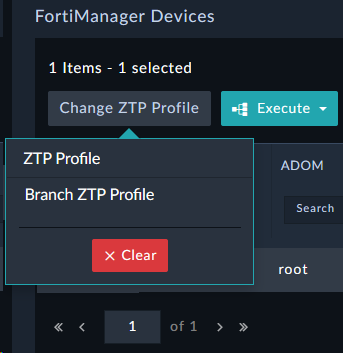
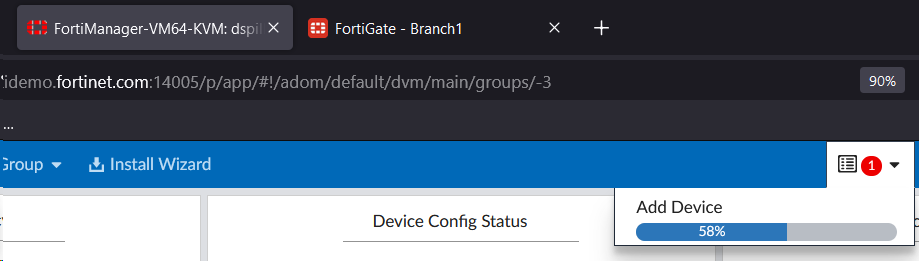
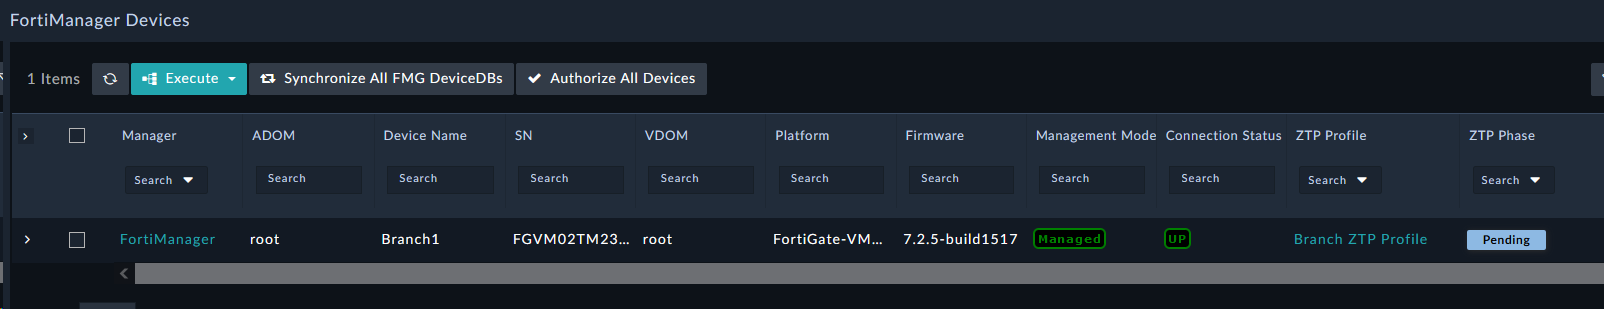
When provisioning devices, there are often unique values that each device needs. For example, the device hostname, the device’s IP address, etc. These values are often unique to each device, so we need a way to provide these values to the device. We can do this using a Manual Input in FortiSOAR. This input dialog can also be emailed to a user
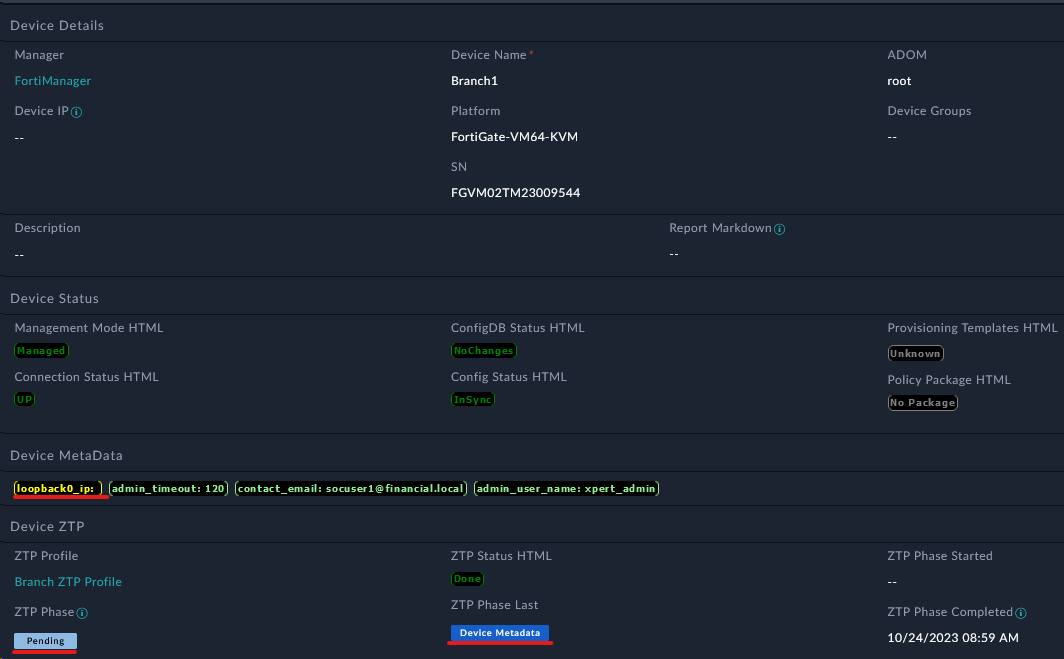

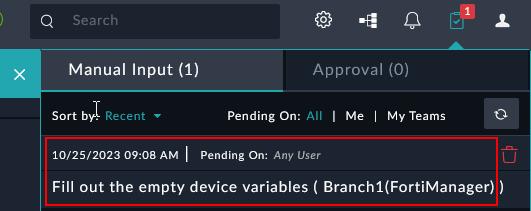
172.16.1.1 in the loopback0_ip field
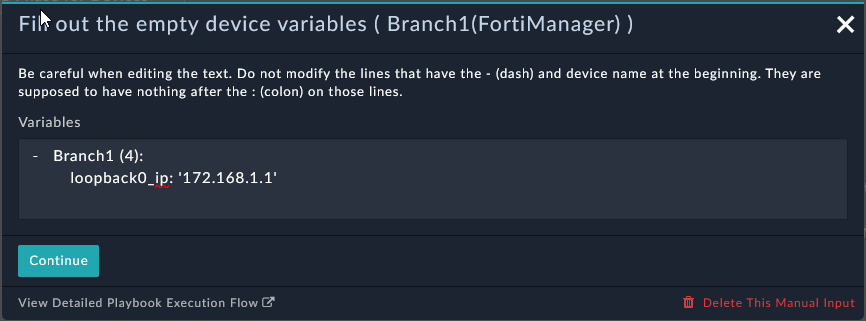
This process will take 1-2 minutes. You can watch the progress in the Workspace tab of the Device record. You will see the comments from the ZTP process. This is a great way to see what happened during the ZTP process. It will show rendered script templates from the Device Metadata.
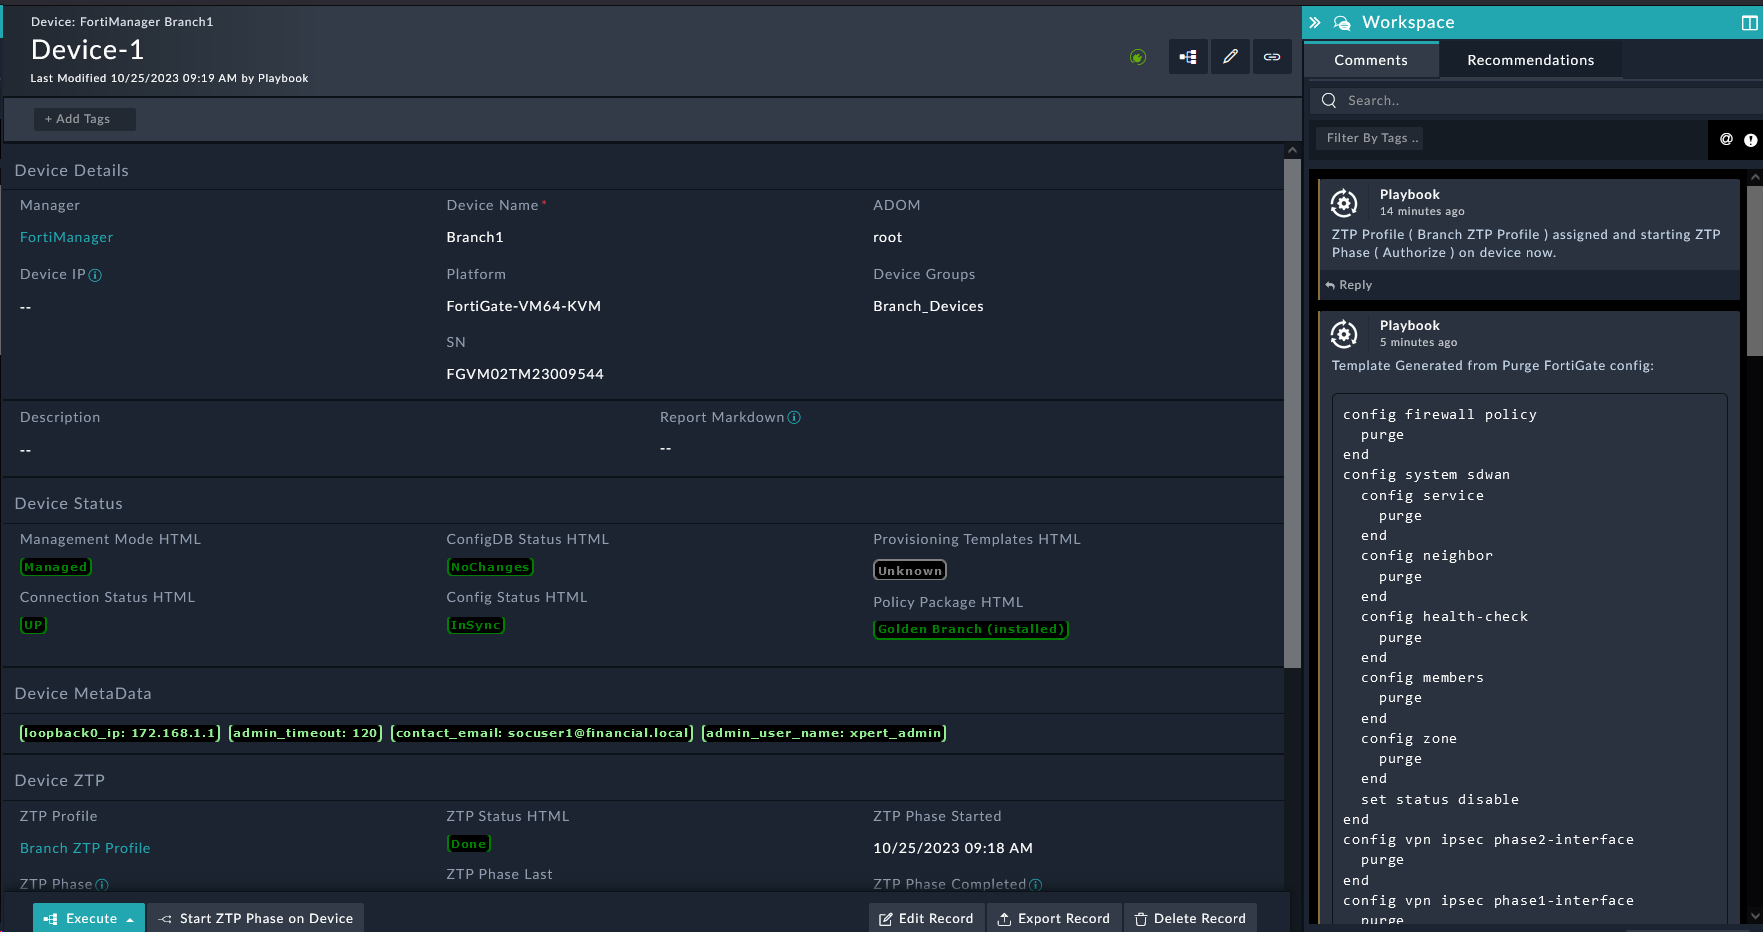
So far there has been a lot of touch! But we’re very close to zero now. In this section we’ll see how to make the ZTP process truly zero touch.
Manual to AutomaticNow the next time a device is created on FortiSOAR, the profile will be assigned automatically without manual intervention.
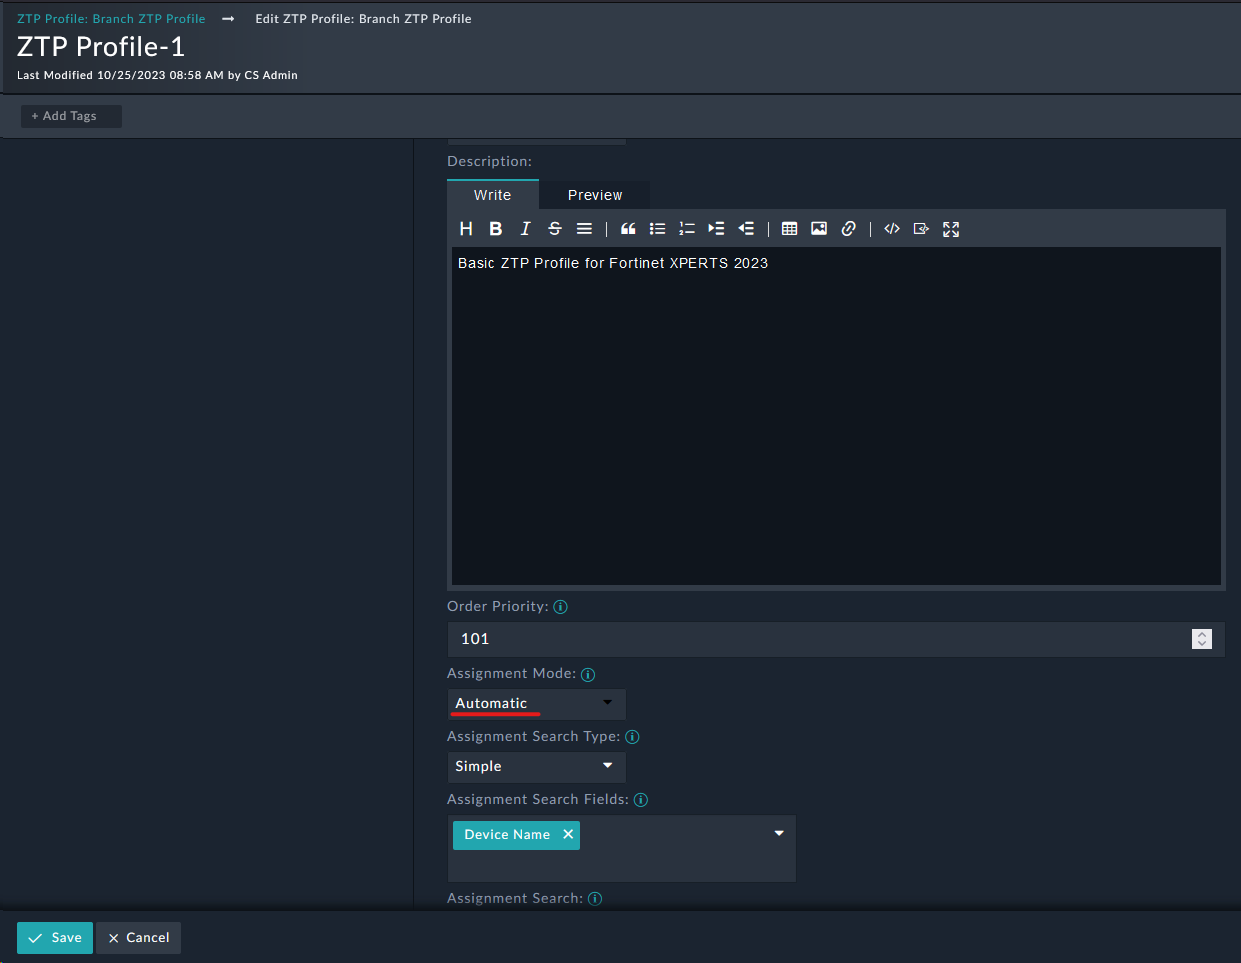
Navigate to Automation > Schedules
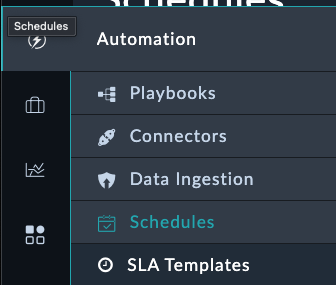
Click Create New Schedule
Fill out the schedule with the following details:
Retrieve Unauthorized FortigatesTrue (enable the schedule)Synch All FMG Device DB ButtonEvery X minutes5 (can be adjusted as low as 1 minute)Click Save
This will automatically pull in new unauthorized devices every 5 minutes, eliminating the need for manual synchronization.
Now you can observe the Branch2 device being automatically:
The entire process should complete without any manual intervention, achieving true zero-touch provisioning.
In this chapter, we learned about Zero Touch Provisioning (ZTP) in FortiSOAR. We installed the ZTP Framework, created a ZTP Profile, and ZTP’d a FortiGate. However, we only touched on a fraction of the features and capabilities of the ZTP Framework. To get a glimpse at the full potential we’ll install the ZTP Examples Solution Pack.
FortiManager ZTP Flow - Feature Examples in the Content Hub
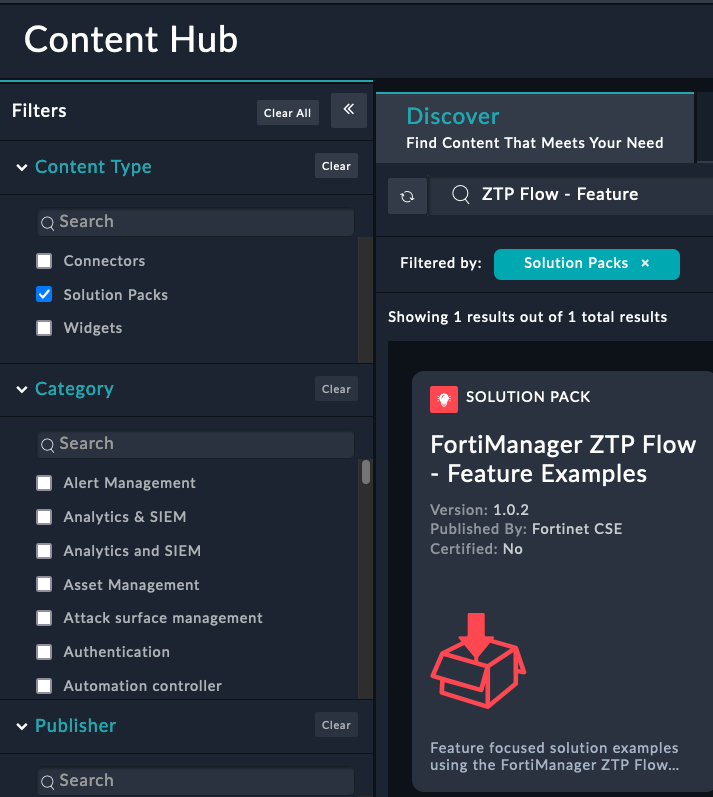
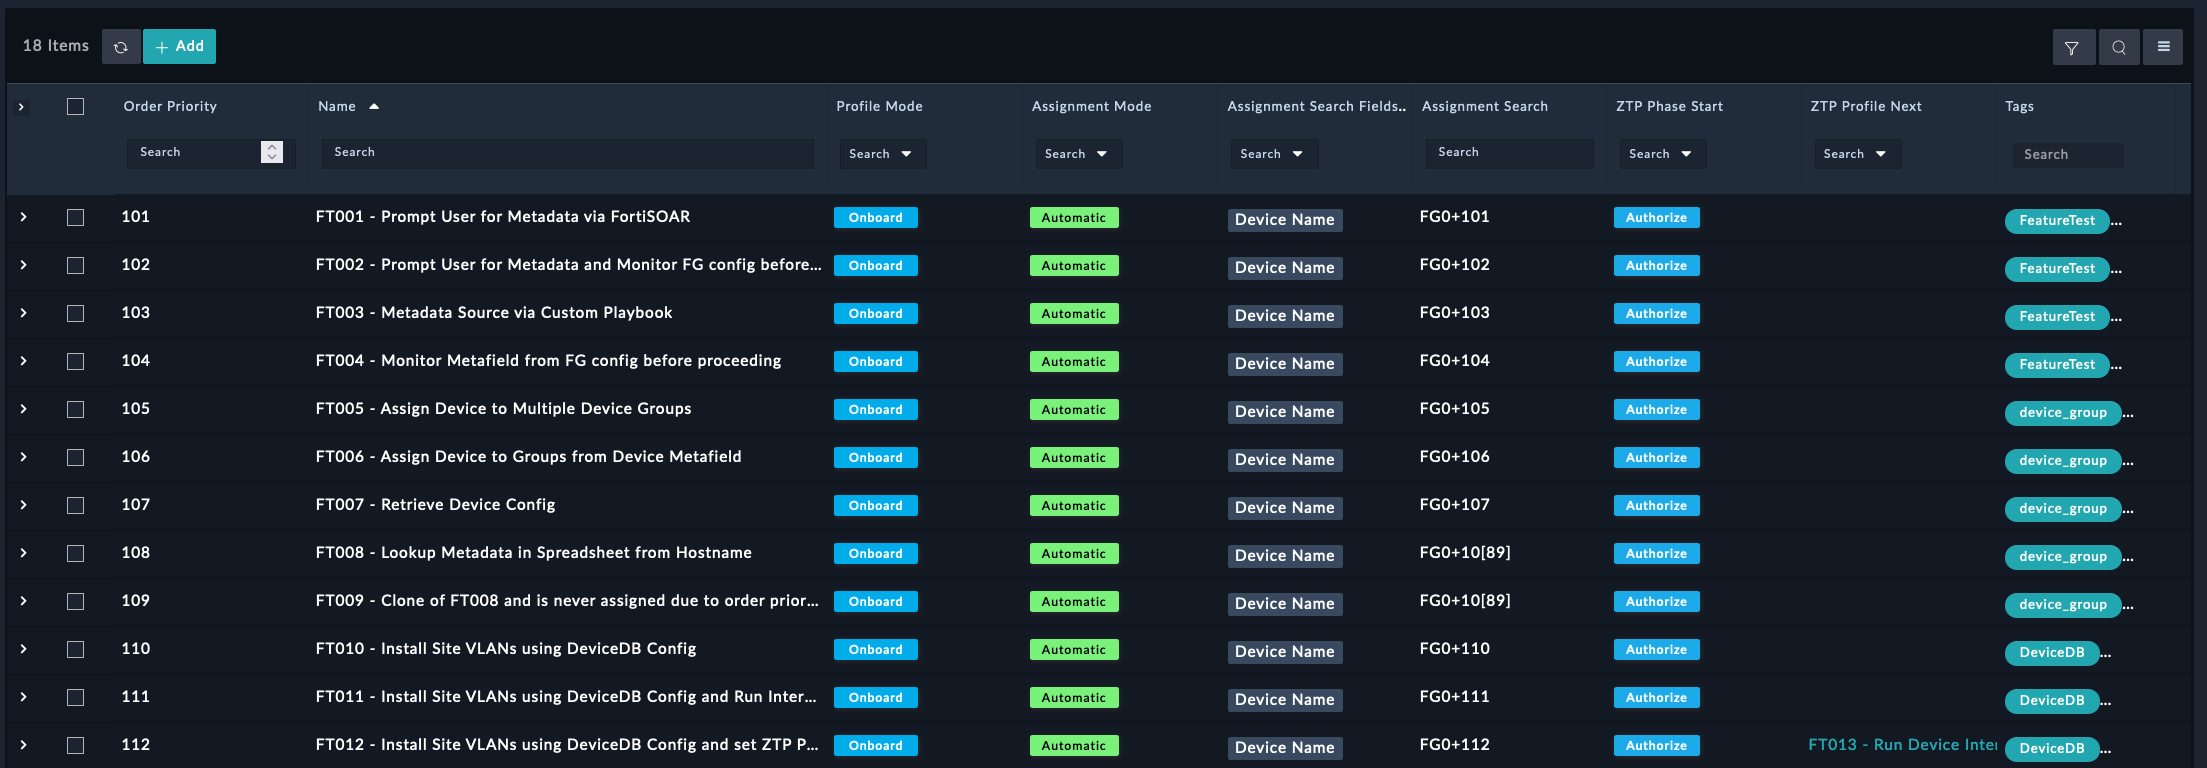
The purpose of each ZTP Profile is to demonstrate different features and capabilities of the ZTP Framework.
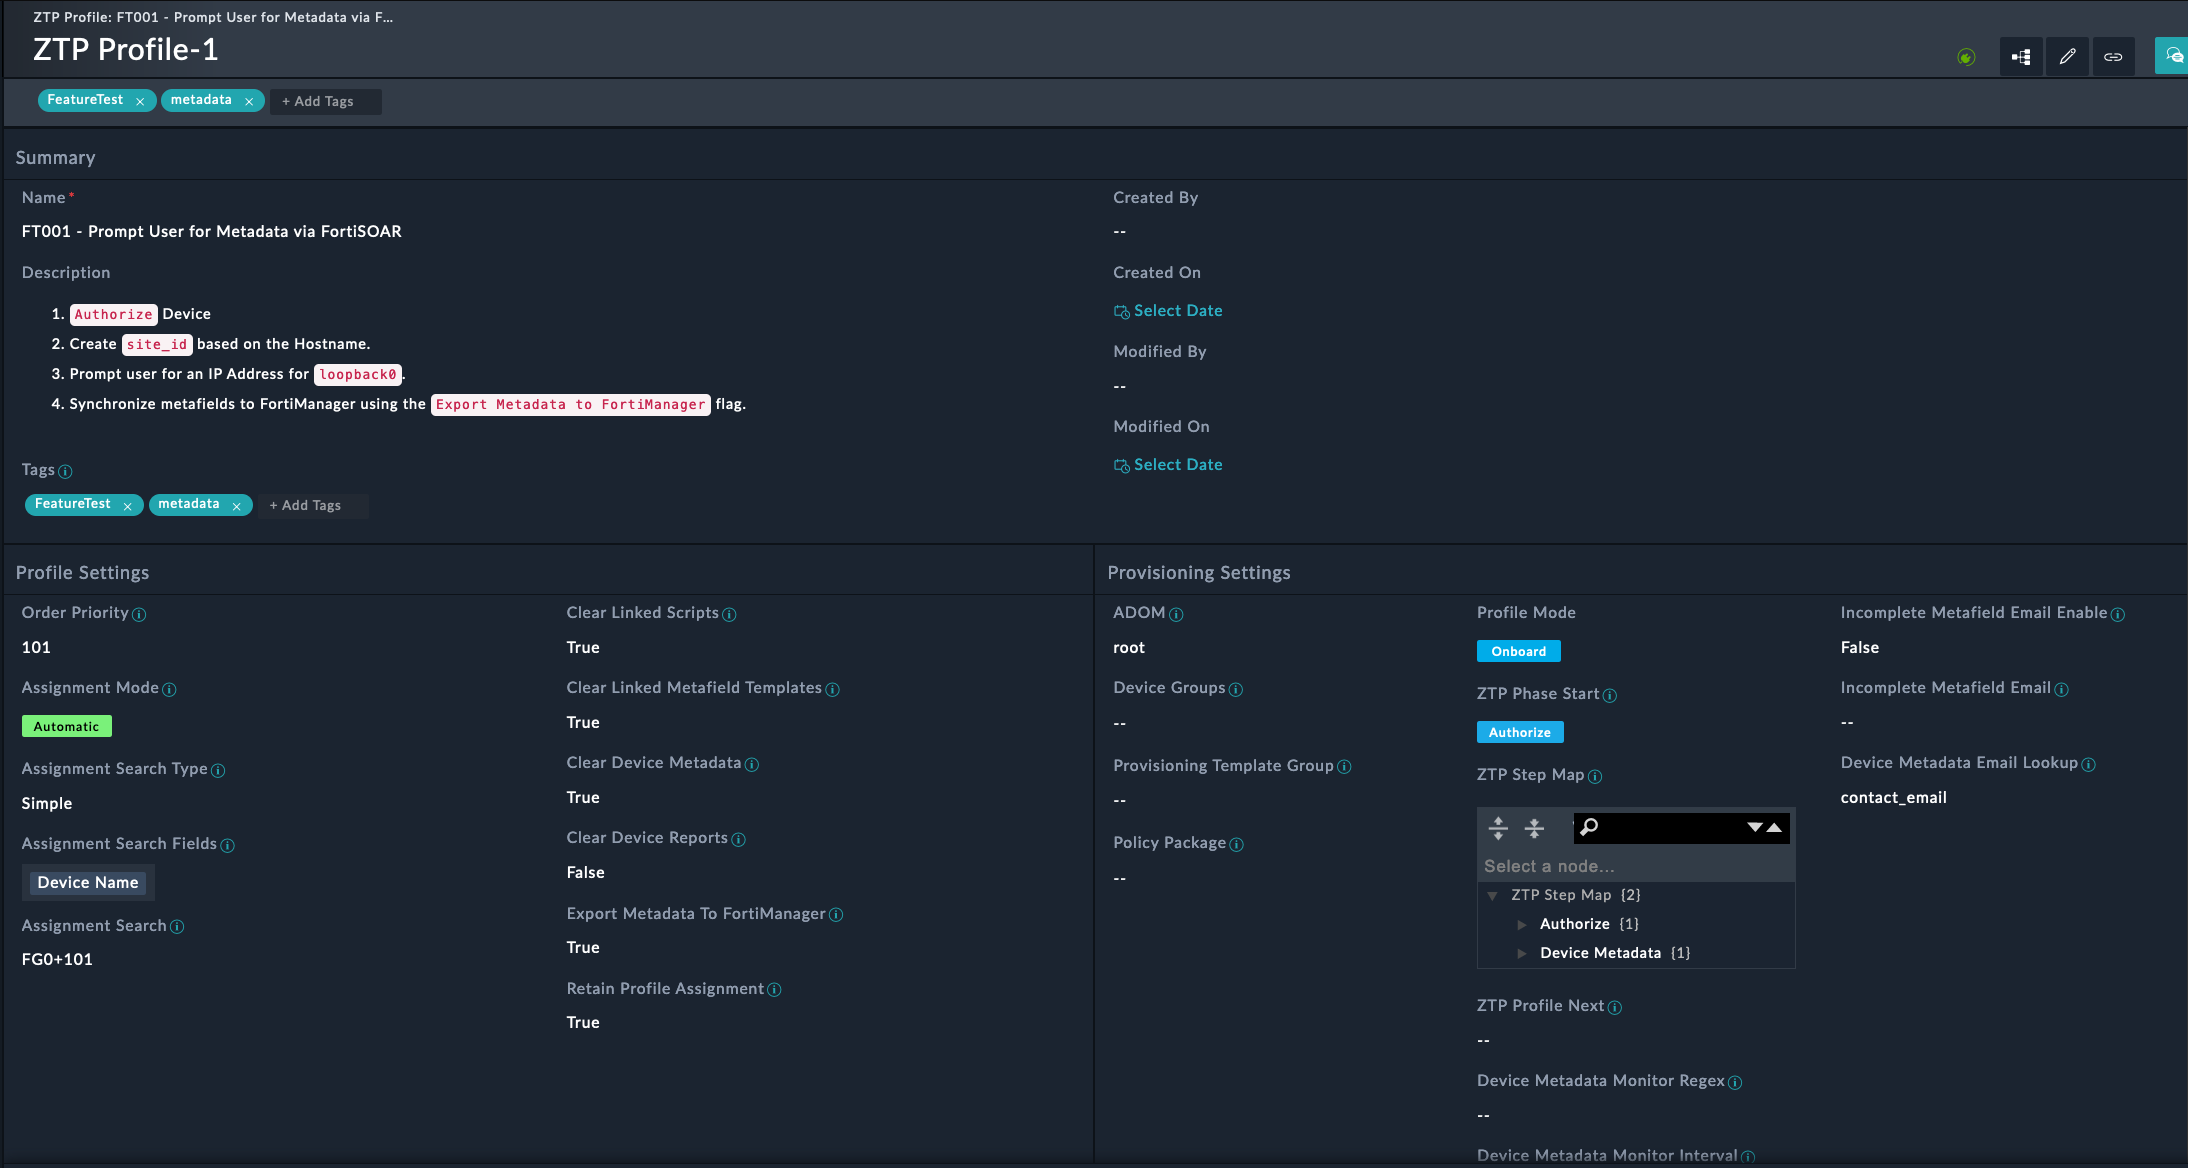
This profile will:
Device Model - Create Randomly
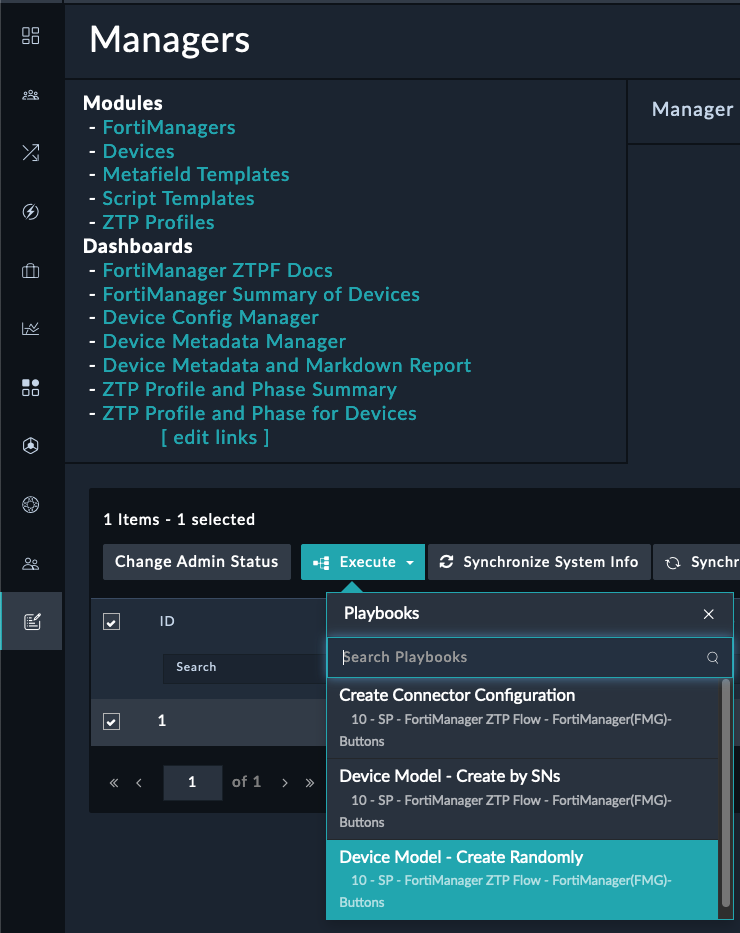
101-118 to the Range of devices input field
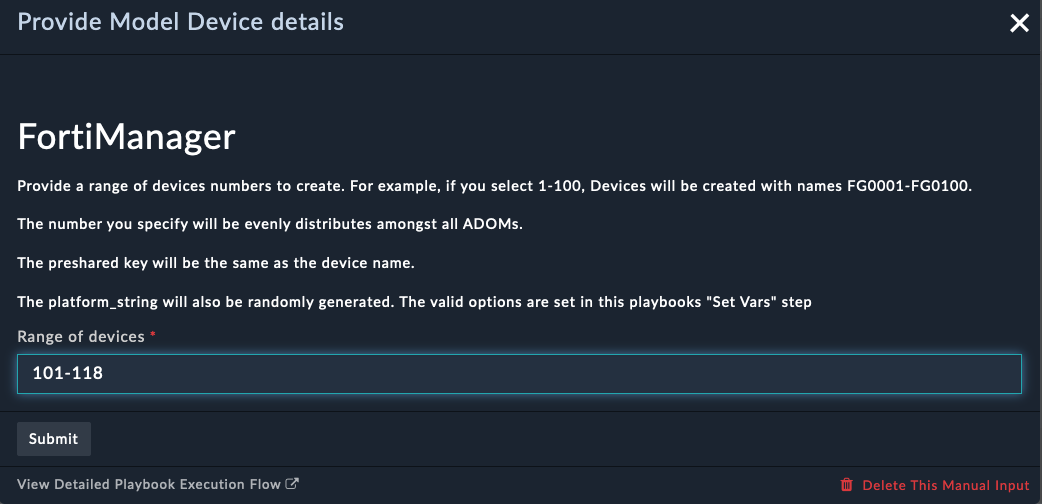
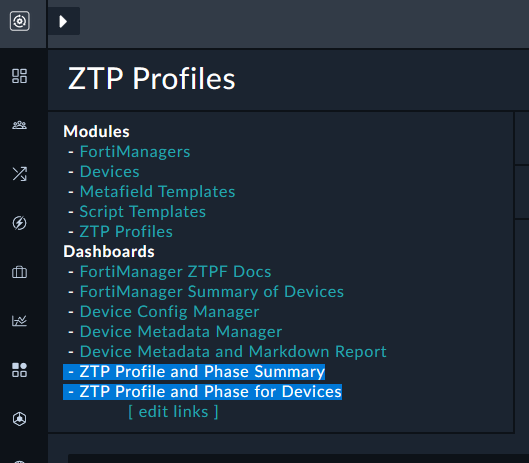
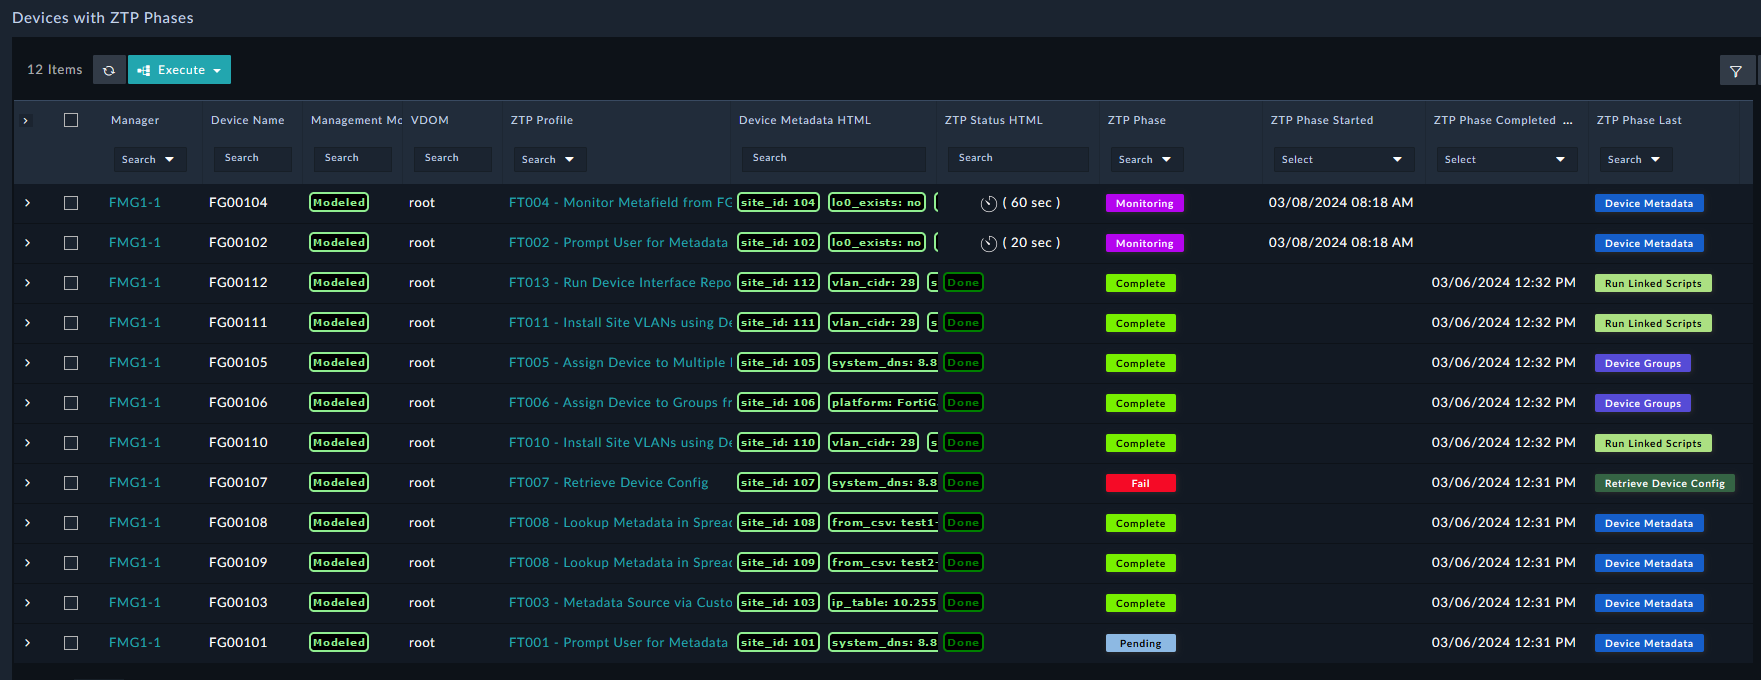
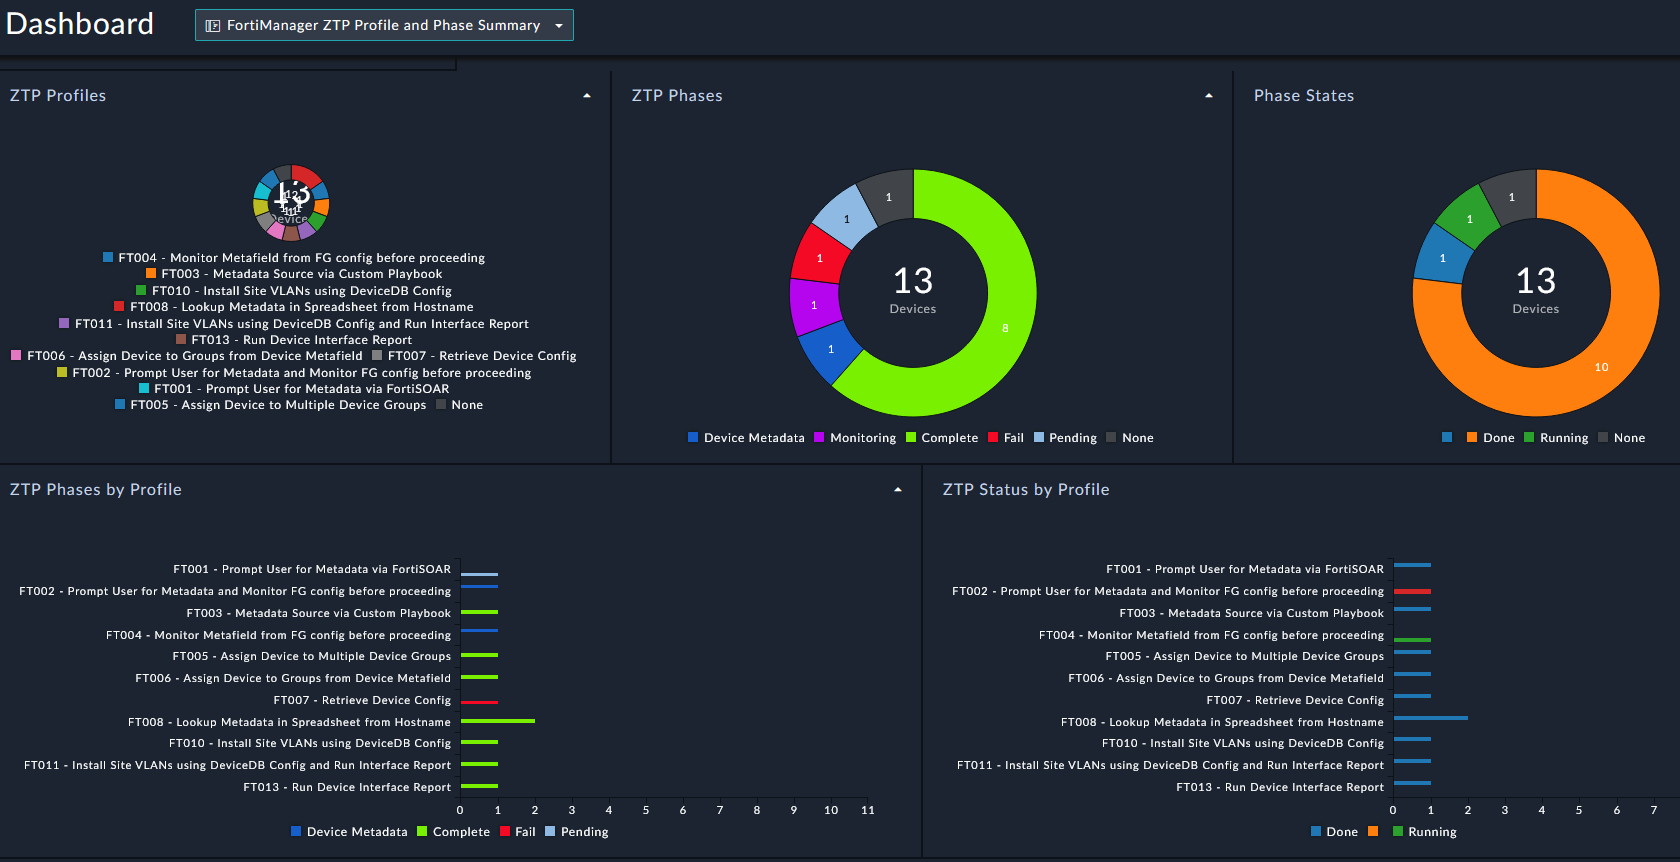
Model devices in FortiManager cannot have a Policy Package pushed to them, so not everything in the ZTP flow can be demonstrated here.
If you check FortiManager, you will also see the model devices in the Devices & Groups section.
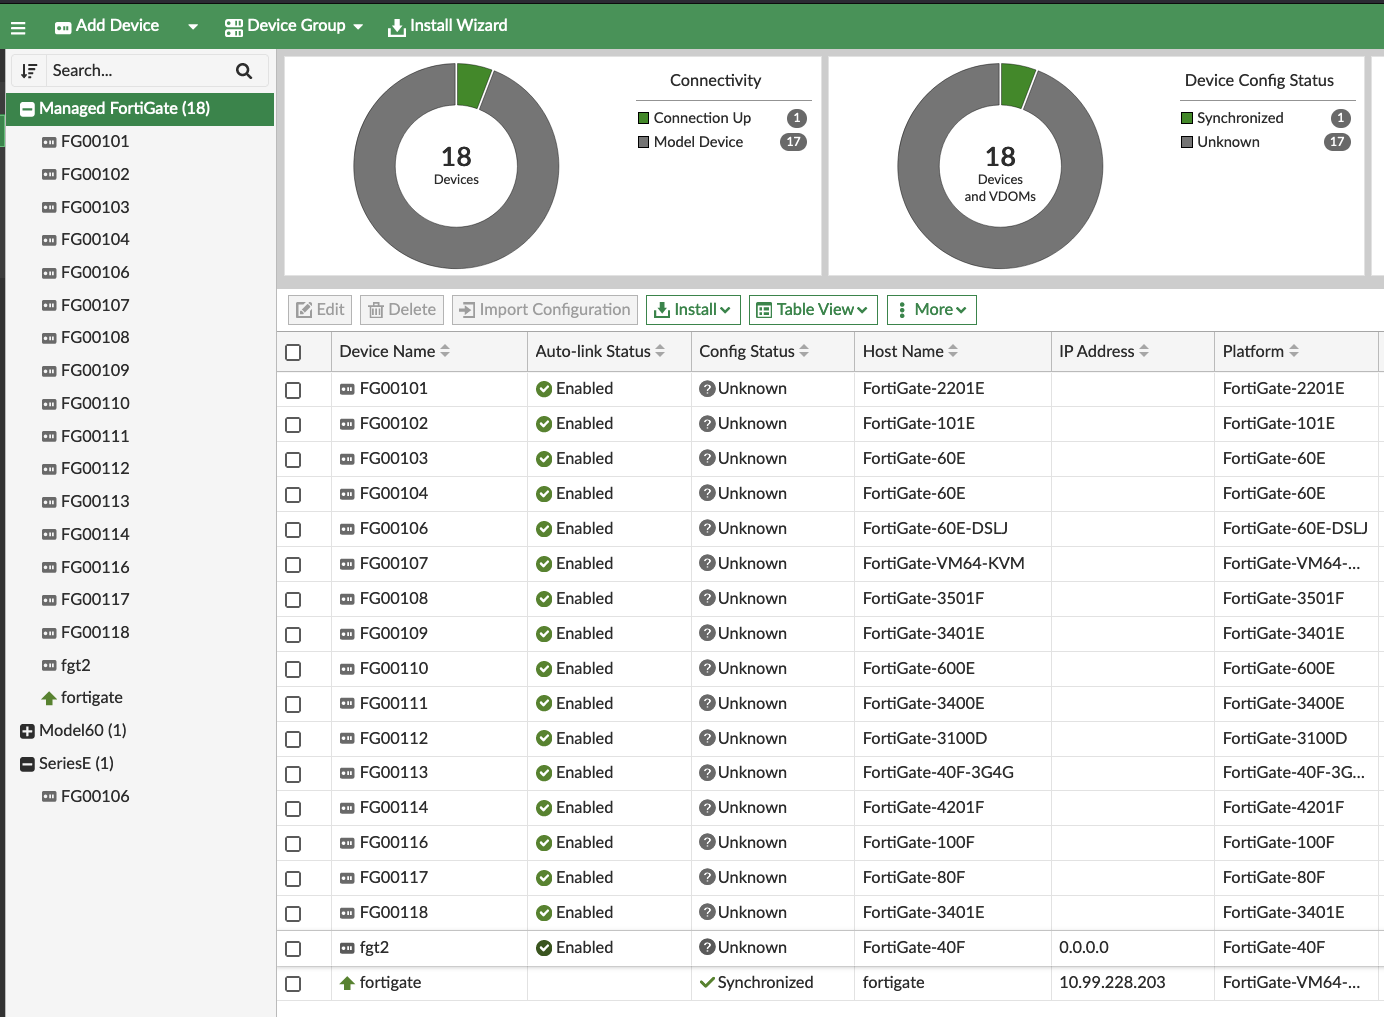
In this chapter, we learned about Zero Touch Provisioning (ZTP) in FortiSOAR. We installed the ZTP Framework, created a ZTP Profile, and ZTP’d a FortiGate. We also installed and used the ZTP Examples Solution Pack.
This framework is a powerful tool for automating the deployment and configuration of FortiGate firewalls. It can save time and effort on setup and maintenance, and be sold as a solution to customers.
It’s important to remember that this solution pack was fully created by CSE’s, without the need for any product backend changes or NFR’s. This is a great example of how FortiSOAR can be used to create completely custom solutions because of its flexible nature. These solutions are easily shareable and can be installed by anyone with access to the Content Hub.
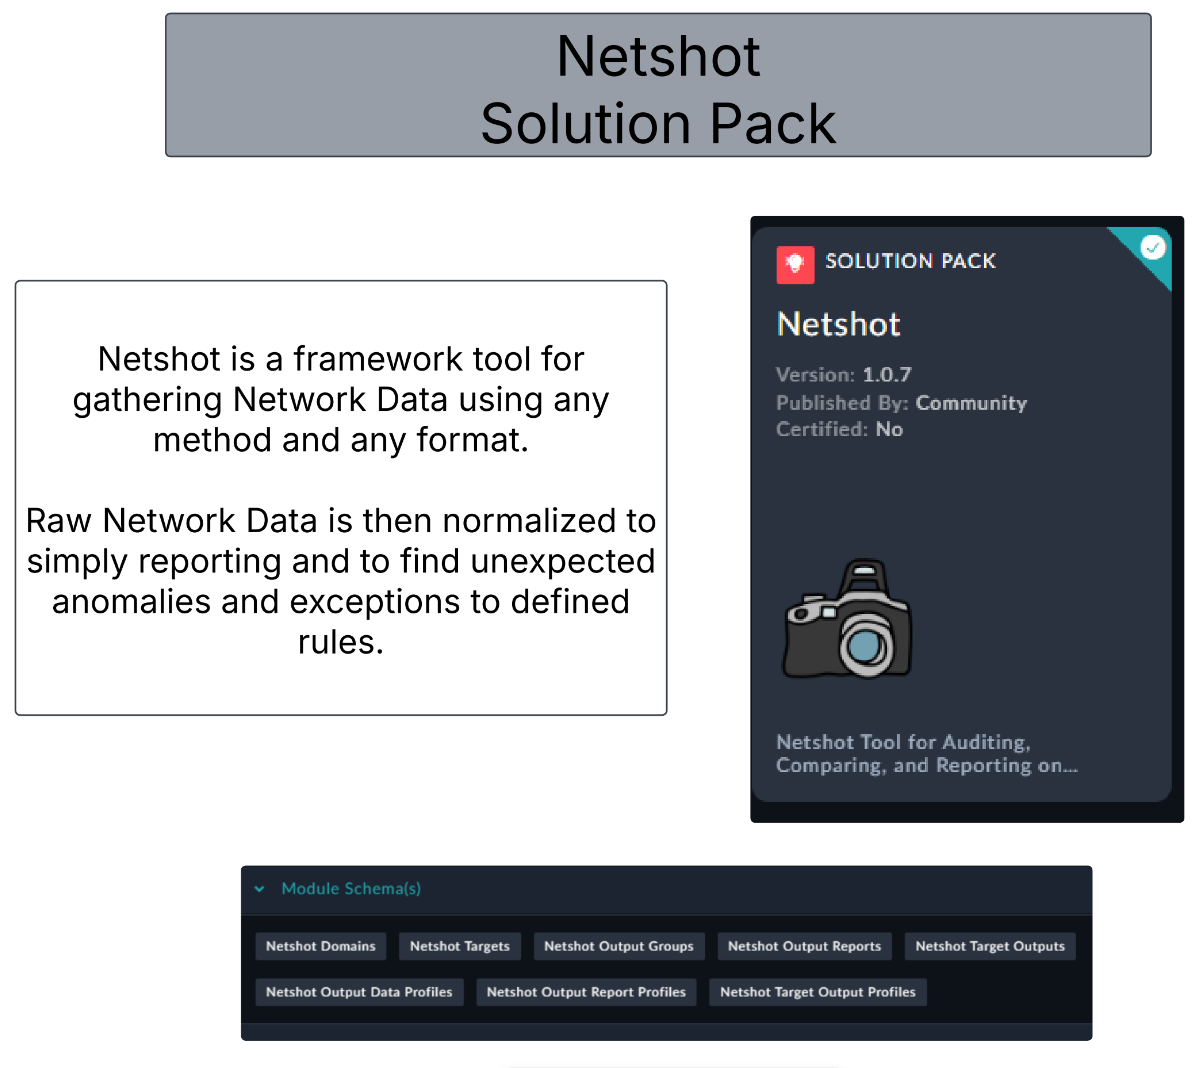
Network device maintainers often need to audit and validate that devices have the configurations they should have, and receive alerts when discrepancies occur. The Netshot SP addresses this need by providing a comprehensive framework for defining how to obtain, normalize, analyze, and alert on network anomalies.
Netshot helps you gather network data using any method and format. Raw network data is then normalized to simplify reporting and identify unexpected anomalies and exceptions to defined rules.
Data Collection: Netshot supports multiple collection methods including SSH, API calls, NMAP scans, and custom scripts. Data can be stored in various formats such as text, JSON, YAML, or CSV.
Data Normalization: Raw network data is converted into normalized formats (text, text lists, JSON, configuration blocks, or custom formats) to simplify reporting and analysis.
Rule-Based Auditing: Normalized data is used in report outputs that can audit configurations based on predefined rules or compare against previously obtained data to detect changes.
Exception Alerting: Report outputs include exception status indicators that flag when something is not as expected or desired from the network.
Configuration Auditing: Collect device configurations as text files, normalize them into configuration blocks, and audit against compliance rules with importance scoring.
Status Monitoring: Gather device status information such as ARP tables, BGP peers, and VPN statistics, then audit for operational anomalies.
Change Detection: When network data is collected multiple times, compare current and previous data to identify unexpected changes.
A practical example involved a customer with 100+ manual audit checks required before and after device upgrades. Using Netshot, they automated the validation process to quickly determine if unexpected changes occurred during upgrades that could indicate outage-causing events.
This automation transformed a time-intensive manual process into an efficient, reliable system for maintaining network integrity and preventing service disruptions.
Download the Solution Pack file below
Login to FortiSOAR
Navigate to the Content Hub

Select the Manage Tab
Click Upload> Upload Solution Pack
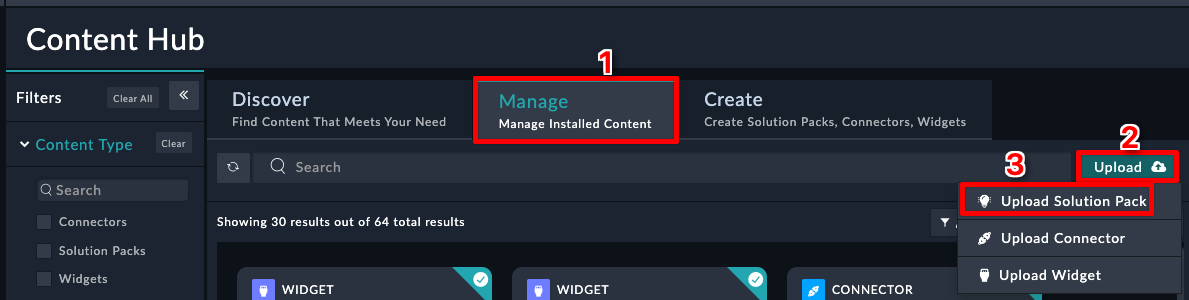
Select the File you downloaded
Click Install
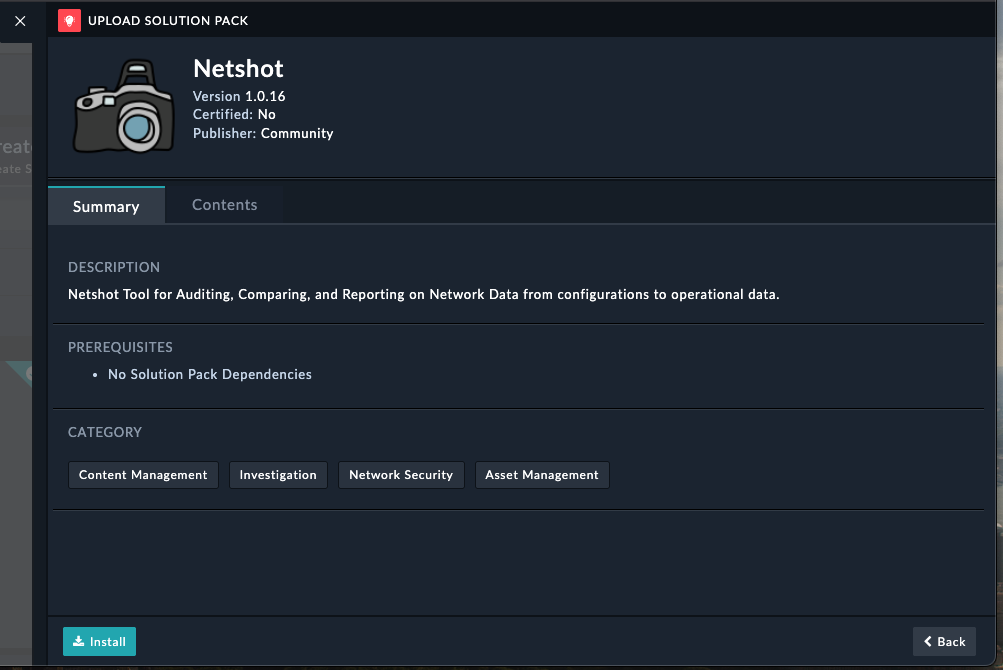
Click Confirm
Wait for the SP to finish installing. Should take ~2 minutes
We need to add a default configuration to the code snippet connector to make sure the playbooks have a valid one to use.
Code Snippet
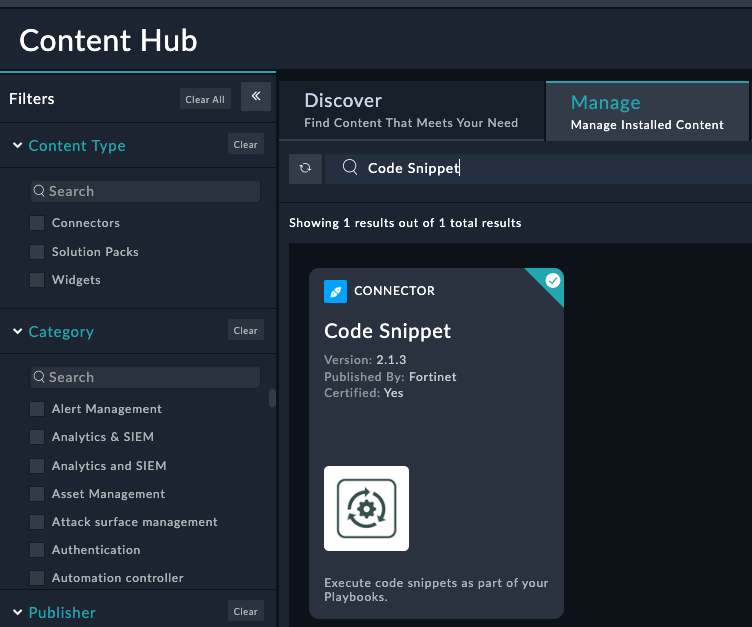
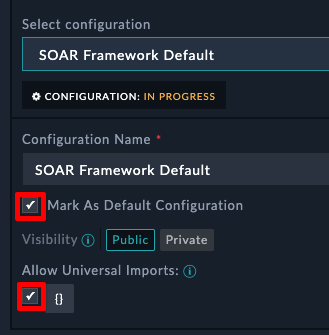
These settings are critical to Netshot working properly.
Navigate to System Settings > Roles

Open Full App Permissions
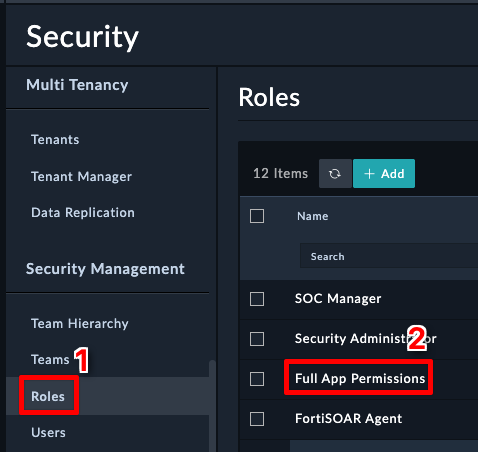
Click the highlighted + icon shown in the picture below.
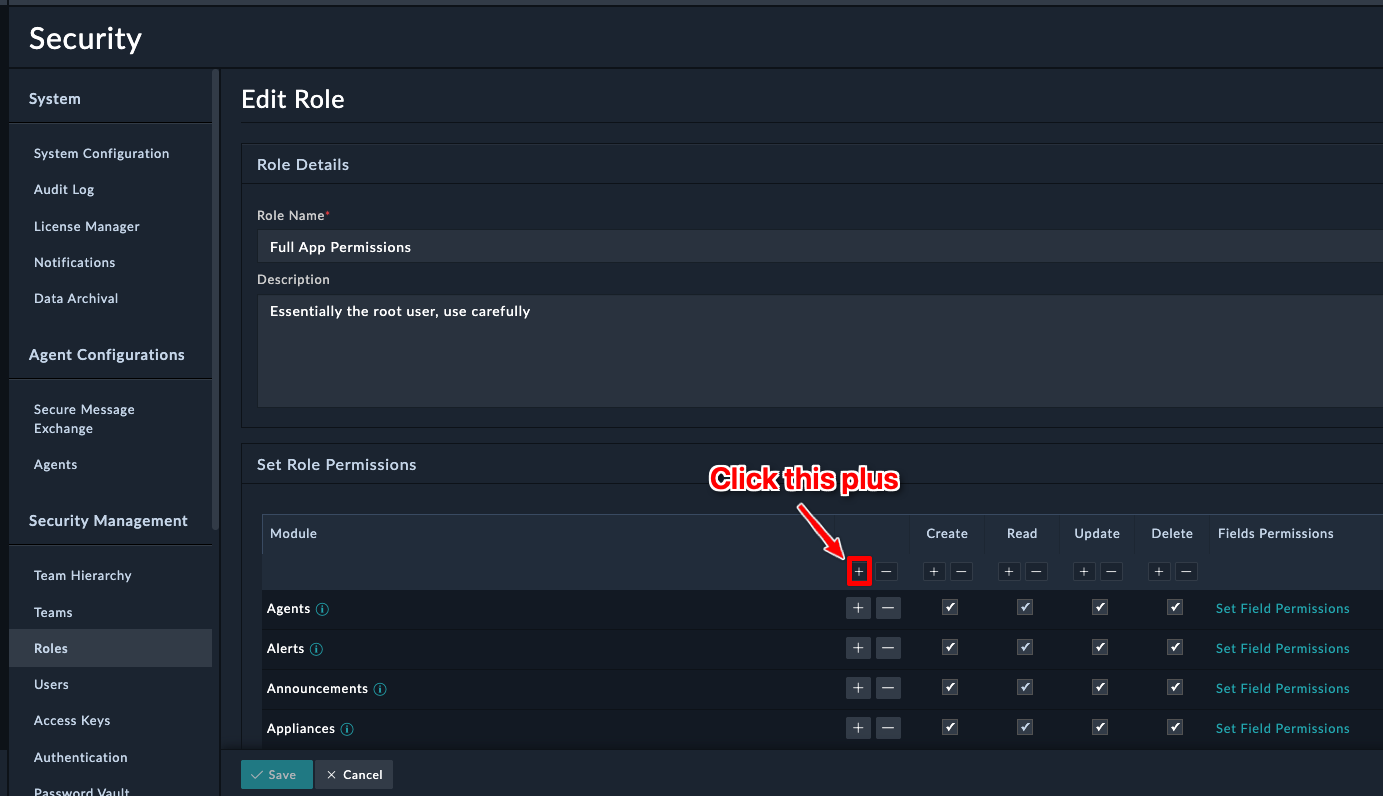
Click Save
After clicking Save, you should see a new section appear on the left navigation pane
If you don’t see the navigation for Netshot, log out of SOAR and log back in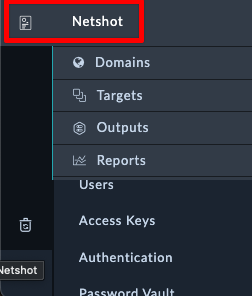
Tip
Download the Workshop Example file below
FortiSOAR-Export-NetshotWorkshop... file
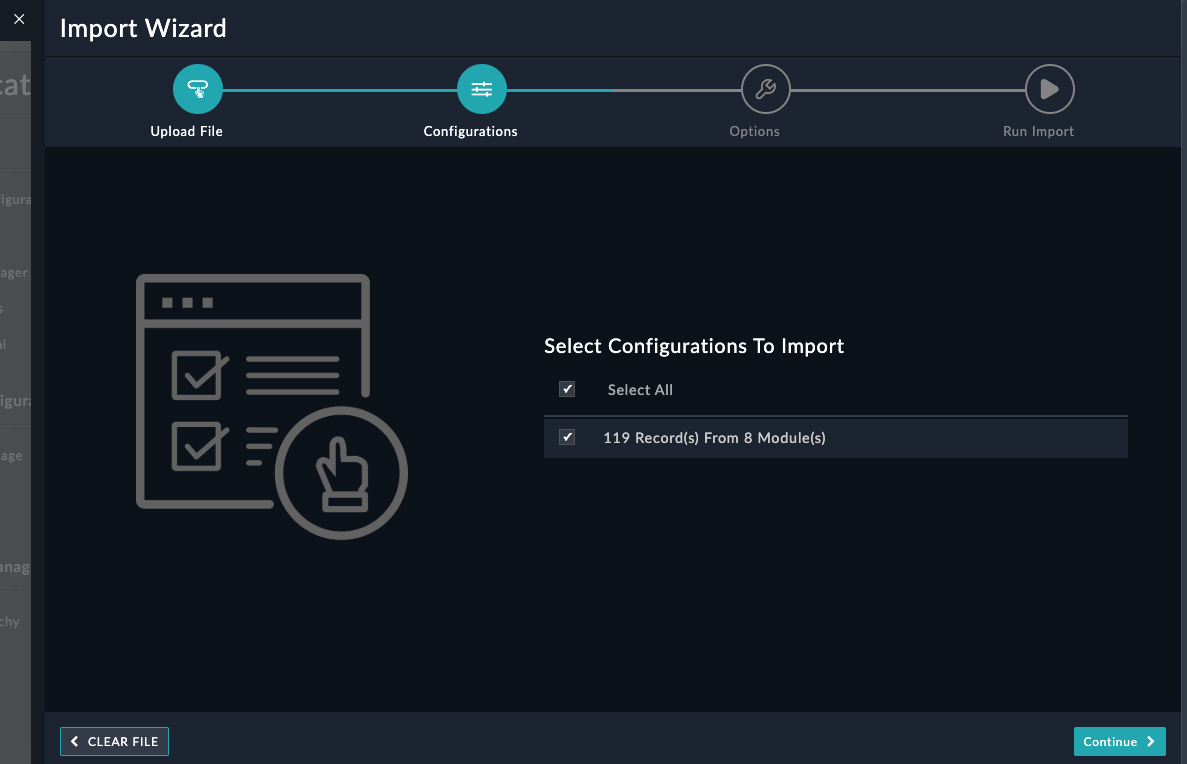
Make sure you see “X Records..” before proceeding. If you see other options, you likely selected the wrong file.
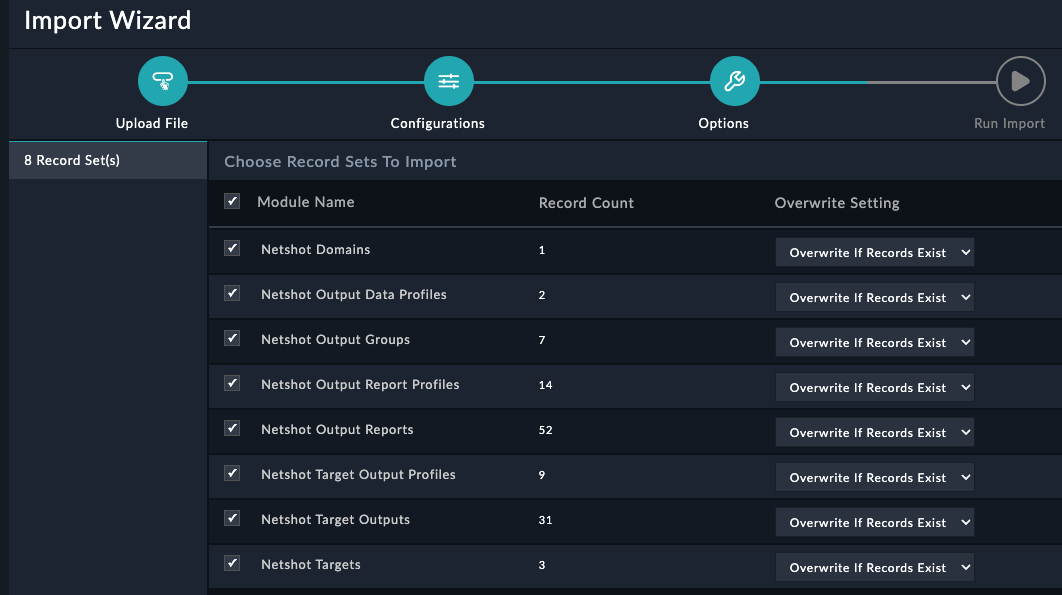
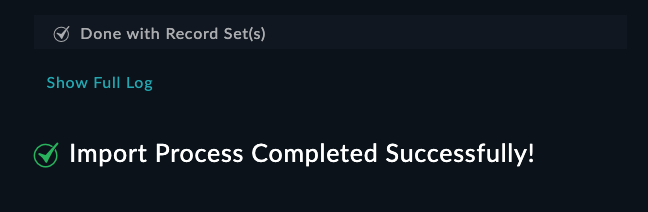
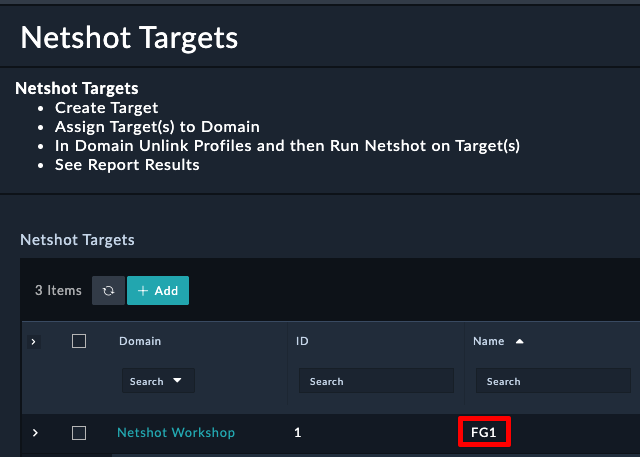

Branch110.100.88.8$3curityFabric
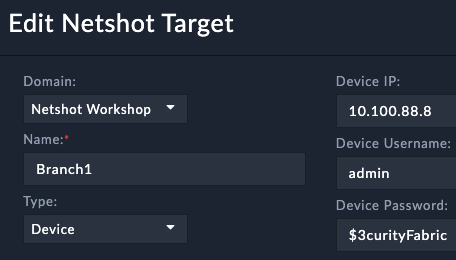
Click the tab Netshot Data, then click the button Run Netshot
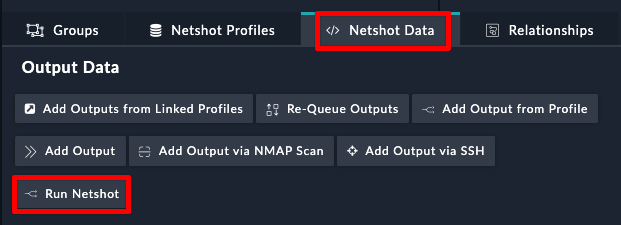
You will notice that the Netshot Status indicator shows Running
You will also notice which data queries are complete or waiting
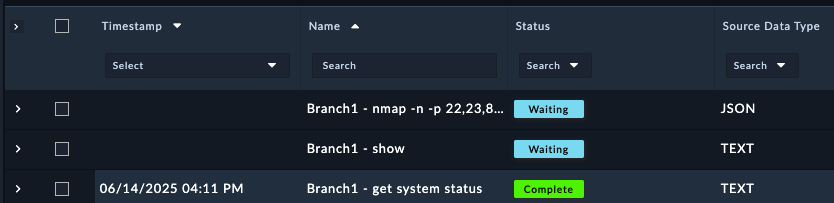
Once netshot completes, you should see a total score that the device earned from the various audits performed. The audit scores come from the profiles that were assigned to the device.
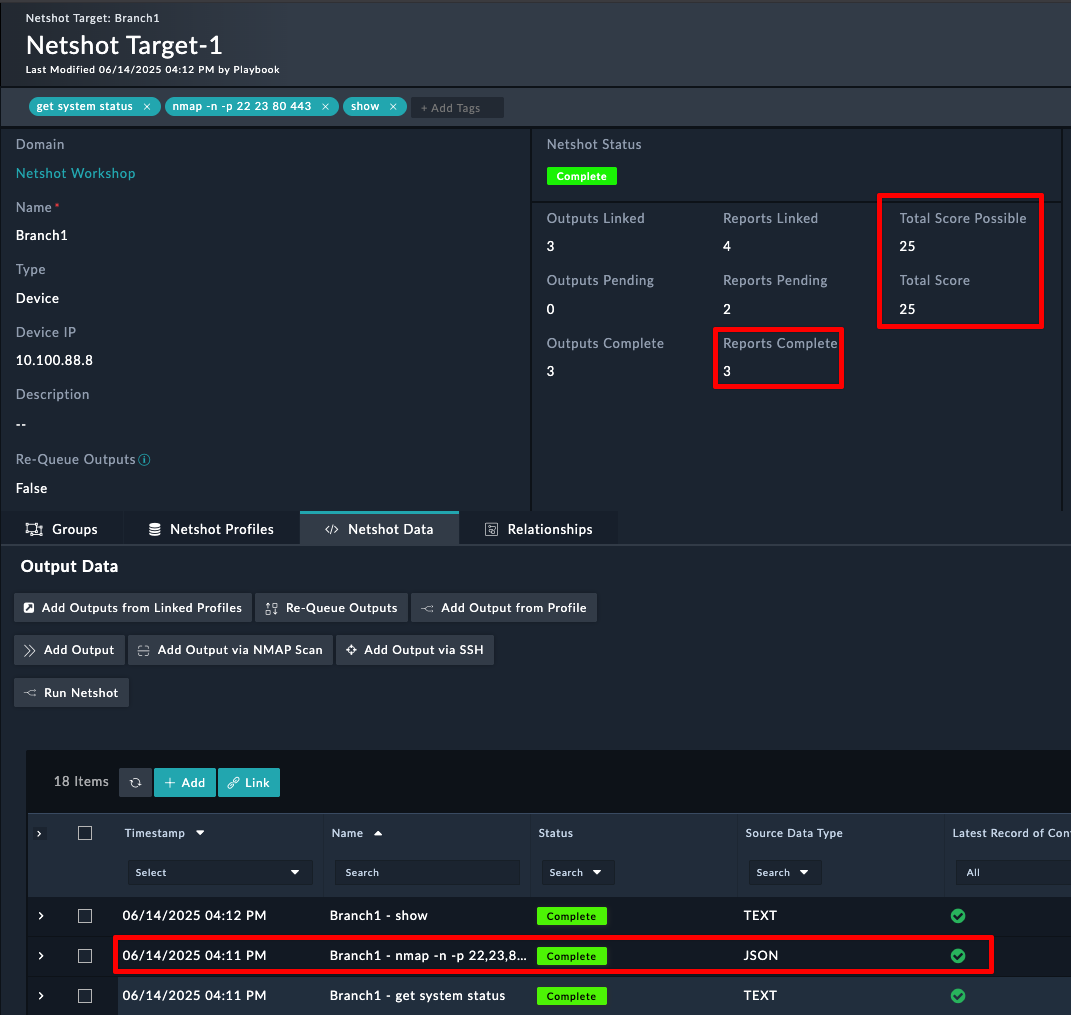
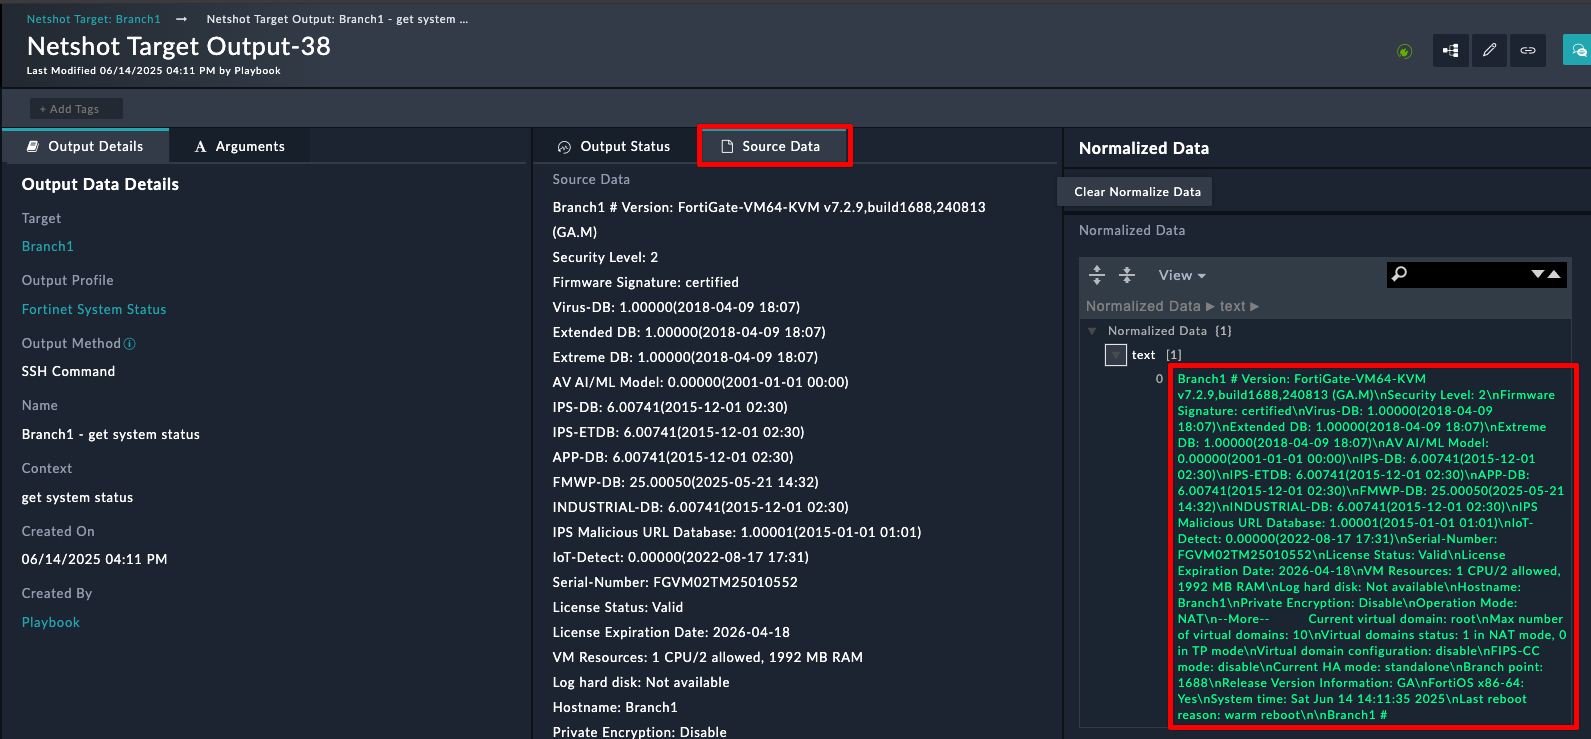 Source data is the raw data from the query, and normalized data is what the raw data was transformed into. In this case, the data wasn’t modified or cleaned in any way
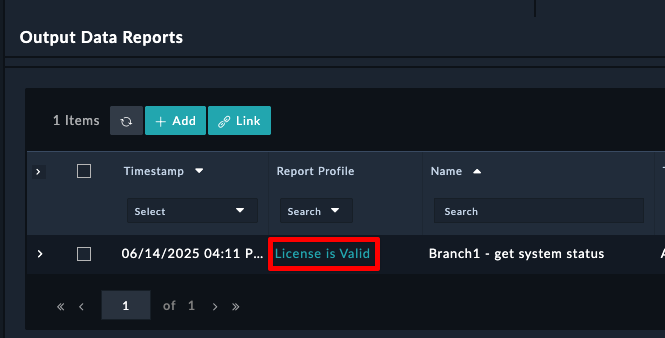
Notice the settings here. This report is saying that the text field from the normalized data must contain a regex of License Status(\s+)?: Valid . If that Regex Pattern Exists, then the report gives out 25 points
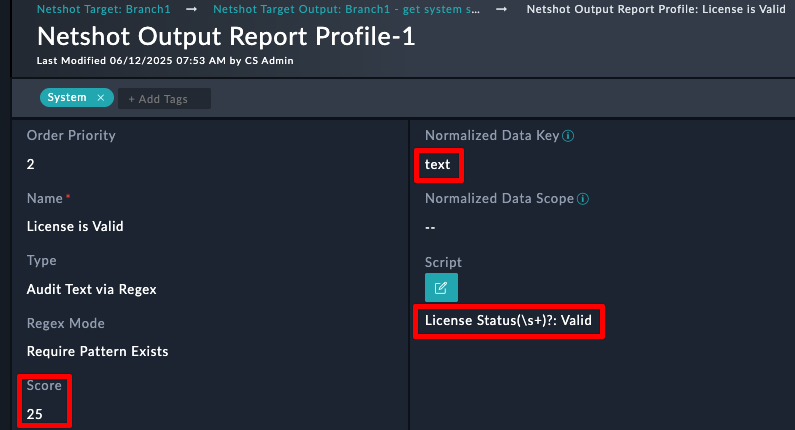
Domains allow you to create a grouping of devices that needed audited.
Notice that the domain consists of 2 Fortigates and 1 Fortimanager
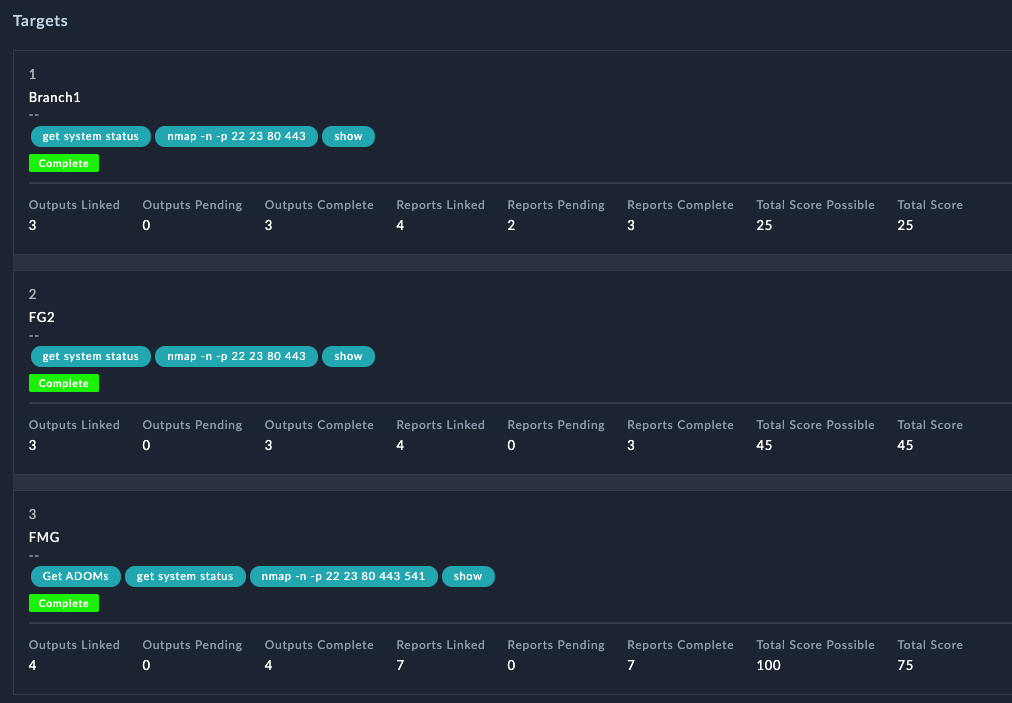


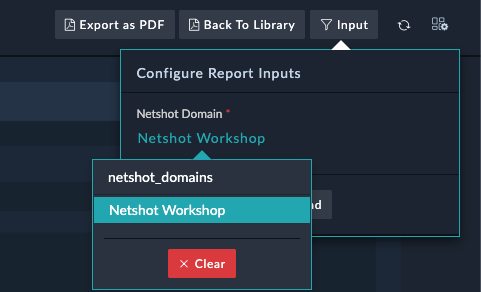
Check out the report, There were some exceptions found from the FMG because it did not meet the specified 7.6 version
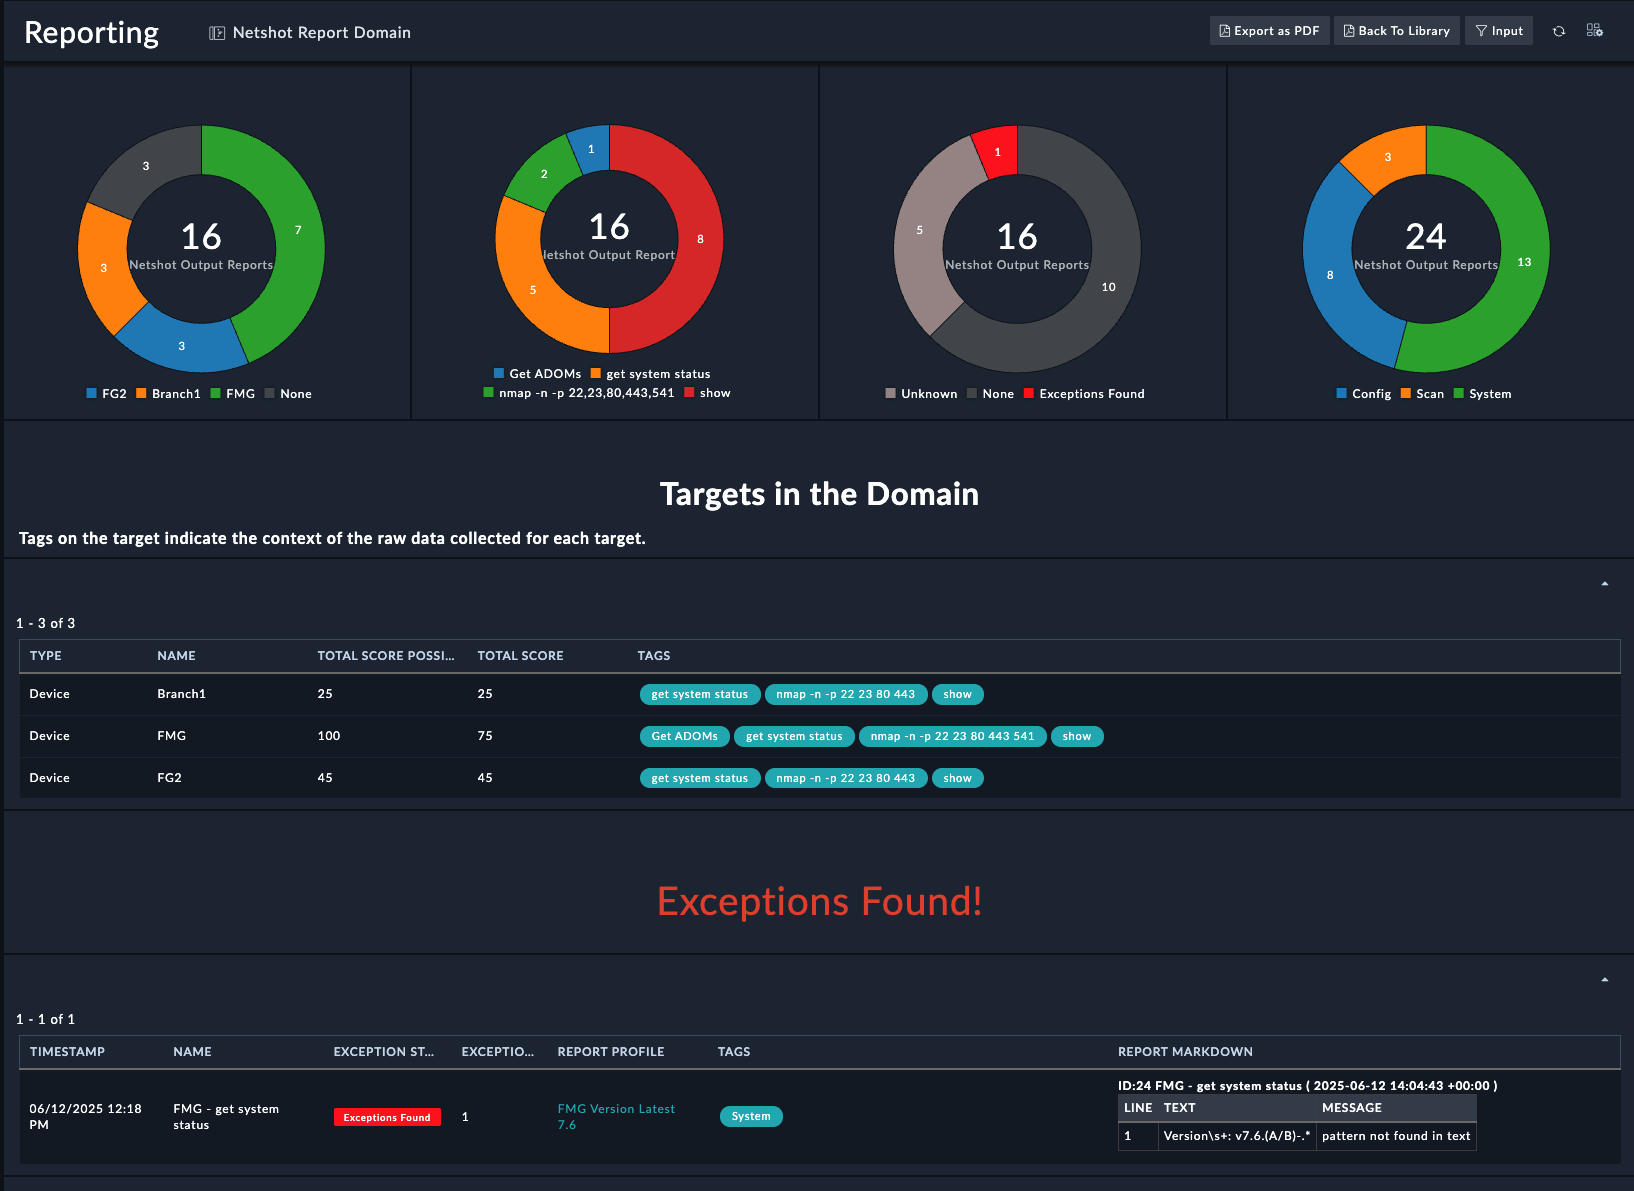
This chapter will cover extra content and use cases that don’t necessarily fit with the other sections
The Splunk connector in FortiSOAR enables powerful SIEM integration capabilities, allowing you to run ad-hoc queries using Splunk Query Language (SPL) and automatically trigger playbooks based on search results. This integration transforms raw log data into actionable security intelligence.
For this guide, we’ll use a Splunk Enterprise trial on AWS, which provides:
Launch Splunk from AWS Marketplace
Initial Access
admin / <instance-id>The HTTP Event Collector allows external systems to send data directly to Splunk via REST API.
Navigate to Data Inputs
Settings → Data Inputs → HTTP Event Collector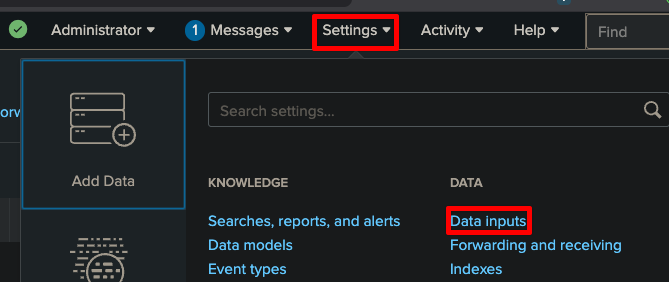
Add New Token
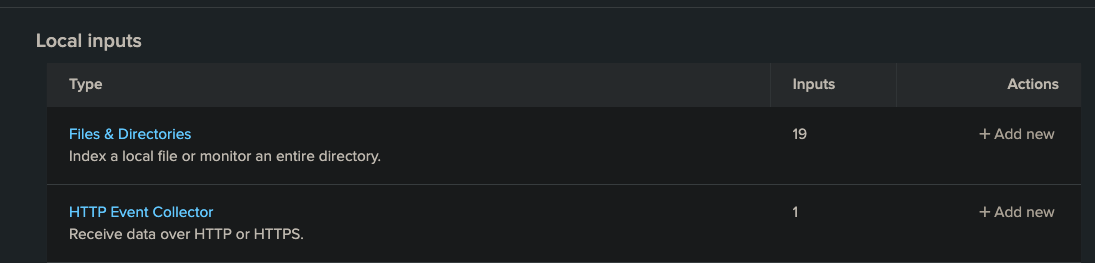
Configure Token Settings
FortiSOAR-IntegrationToken for HTTP log ingestion and queries
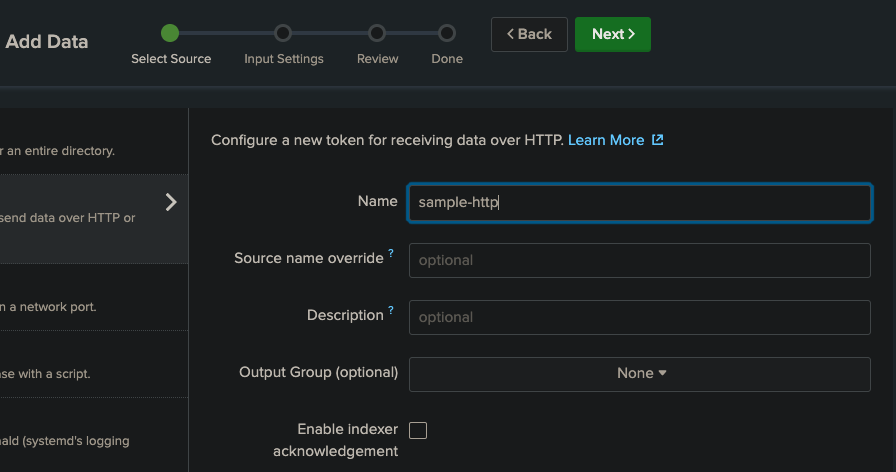
Set Input Settings
fortinet:firewall (for FortiGate logs)main
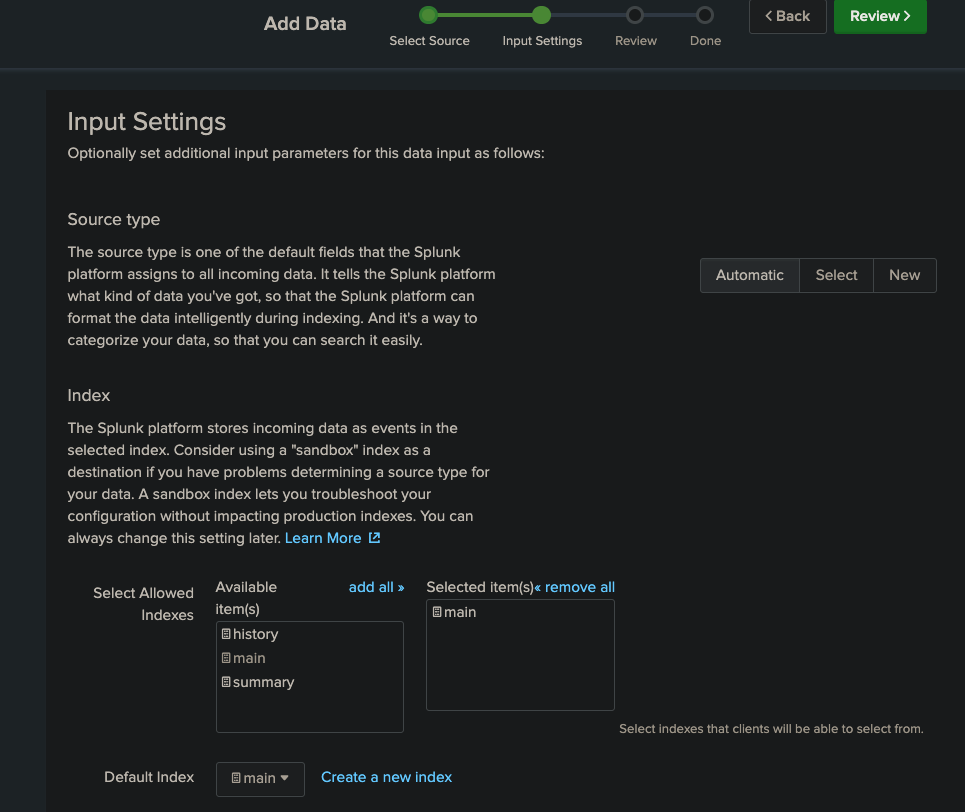
Review and Create
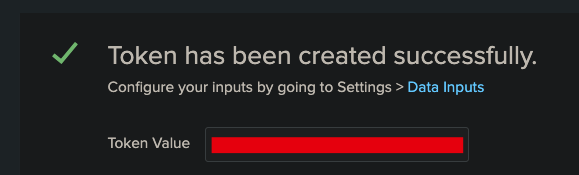
Verify your HEC setup with a simple test:
curl -k "https://<splunk-server>:8088/services/collector" \
-H "Authorization: Splunk <your-hec-token>" \
-d '{"event": "Test event from FortiSOAR setup", "source": "fortisoar_test"}'
Expected response:
{
  "text": "Success",
  "code": 0
}Navigate to Connectors
Automation → Connectors → ManageSearch and Install
Connector Settings
Configuration Name: Splunk-Production
Server URL: https://your-splunk-server:8089
Username: your-splunk-username
Password: your-splunk-password
Protocol: https
Splunk API Port: 8089
Verify SSL: False (unchecked)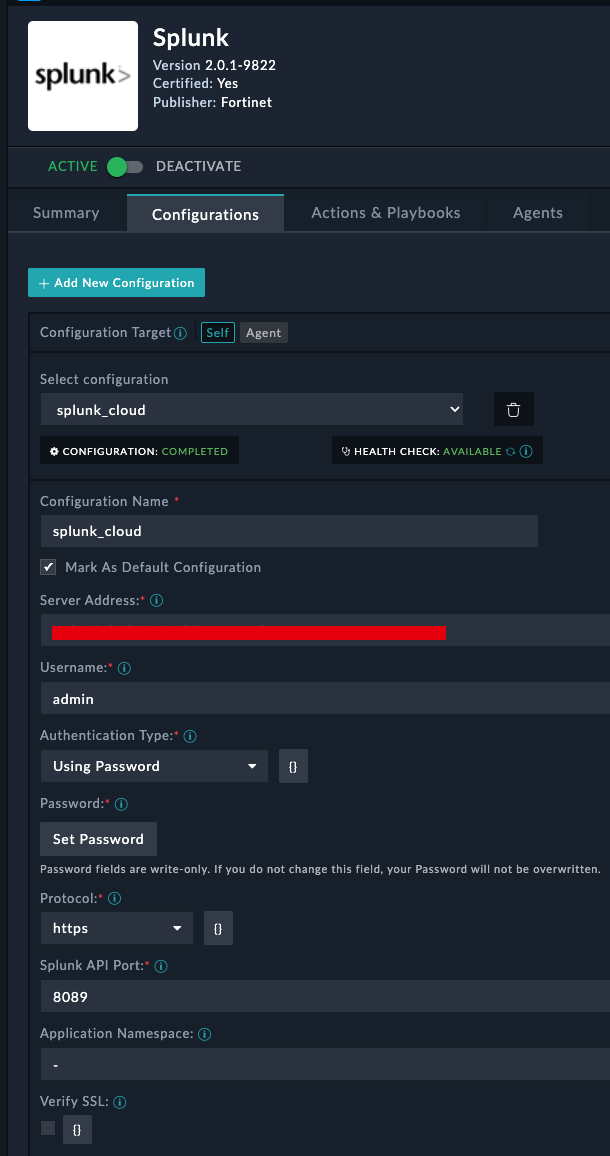
Click Save, and verify you the Health Check passes
You can skip this step if you already have logs in Splunk
Create a Python script to continuously feed FortiGate logs to Splunk:
This python could be ran directly from the Code snippet step in fortisoar
#!/usr/bin/env python3
"""
FortiGate to Splunk Log Forwarder
Reads FortiGate logs and forwards them to Splunk HEC
"""

import random
import requests
from datetime import datetime

# Configuration
SPLUNK_HEC_URL = "https://your-splunk-server:8088/services/collector"
SPLUNK_HEC_TOKEN = "your-hec-token-here"

# Device names (simulate 5 FortiGate firewalls)
devices = [f"FG100F-{i:03d}" for i in range(1, 6)]

# Sample BPDU event template
log_template = (
    '<134>date={date} time={time} devname="{devname}" devid="{devid}" '
    'eventtime={eventtime} tz="+0000" logid="0419016384" type="event" '
    'subtype="system" level="alert" vd="root" logdesc="BPDU packet received" '
    'msg="BPDU packet received on {port}, shutting down the port."'
)

# Generate 20 logs
for _ in range(20):
    now = datetime.utcnow()
    devname = random.choice(devices)
    devid = f"{devname}-SN{random.randint(100000, 999999)}"
    port = f"port{random.randint(1, 5)}"

    log = log_template.format(
        date=now.strftime("%Y-%m-%d"),
        time=now.strftime("%H:%M:%S"),
        devname=devname,
        devid=devid,
        eventtime=int(now.timestamp() * 1_000_000),
        port=port
    )
    print(log)

    payload = {
        "event": log,
        "sourcetype": "fortinet:firewall"
    }

    response = requests.post(
        SPLUNK_HEC_URL,
        headers={"Authorization": f"Splunk {SPLUNK_HEC_TOKEN}"},
        json=payload,
        verify=False  # Set to True if you have proper TLS setup
    )

    if response.status_code != 200:
        print(f"Error: {response.status_code} - {response.text}")
    else:
print(f"Sent log from {devname}")Make sure to update your server url and API token in the code snippet to match your environment
After running the script, lets check that we see logs in Splunk
sourcetype="fortinet:firewall"
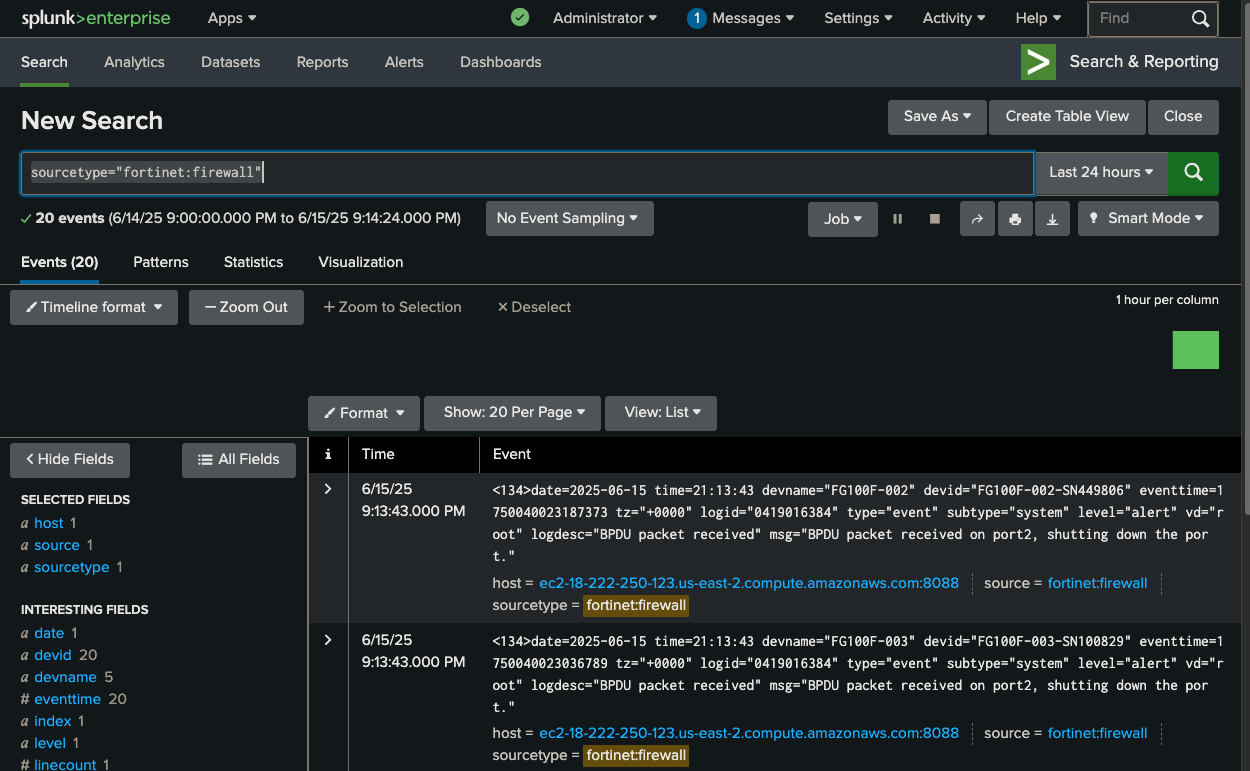
Create a new playbook. Name it BPDU Splunk Query for easy searching later
You can use the Referenced Start step for testing
Drag a new step from the Start, and select Connector
Select Splunk
Query BPDU Packets index=main sourcetype=fortinet:firewall "BPDU packet received"
| bin _time span=1m
| stats count as bpdu_count by devname, _time
| where bpdu_count > 3
| stats sum(bpdu_count) as total_bpdu_events by devname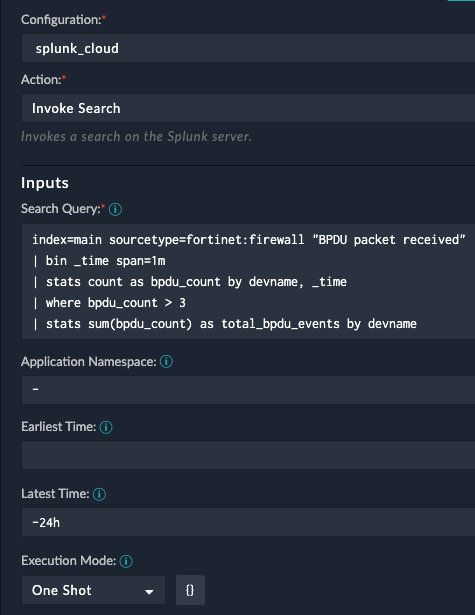
Save the step
Save and run the playbook.
Check the playbook results. If your query worked you will see output like this
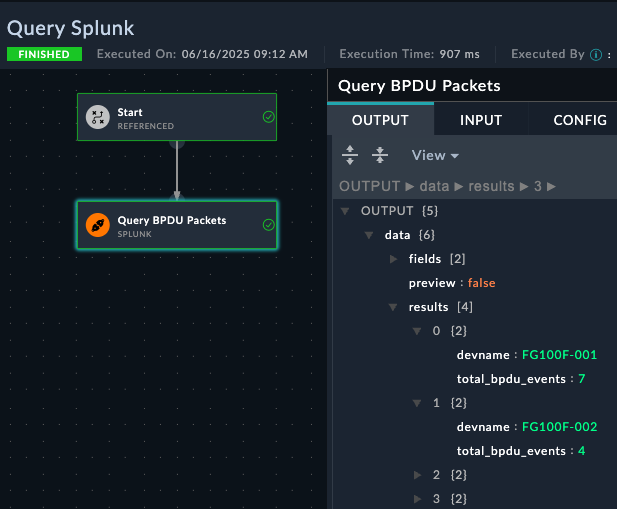
Trigger Splunk QueryBPDU packet received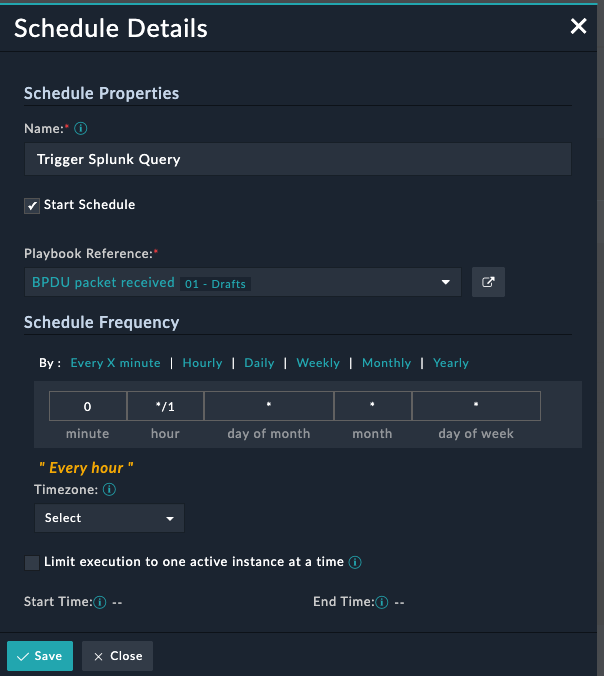
Using the browser network debug to identify the syntax of the filter
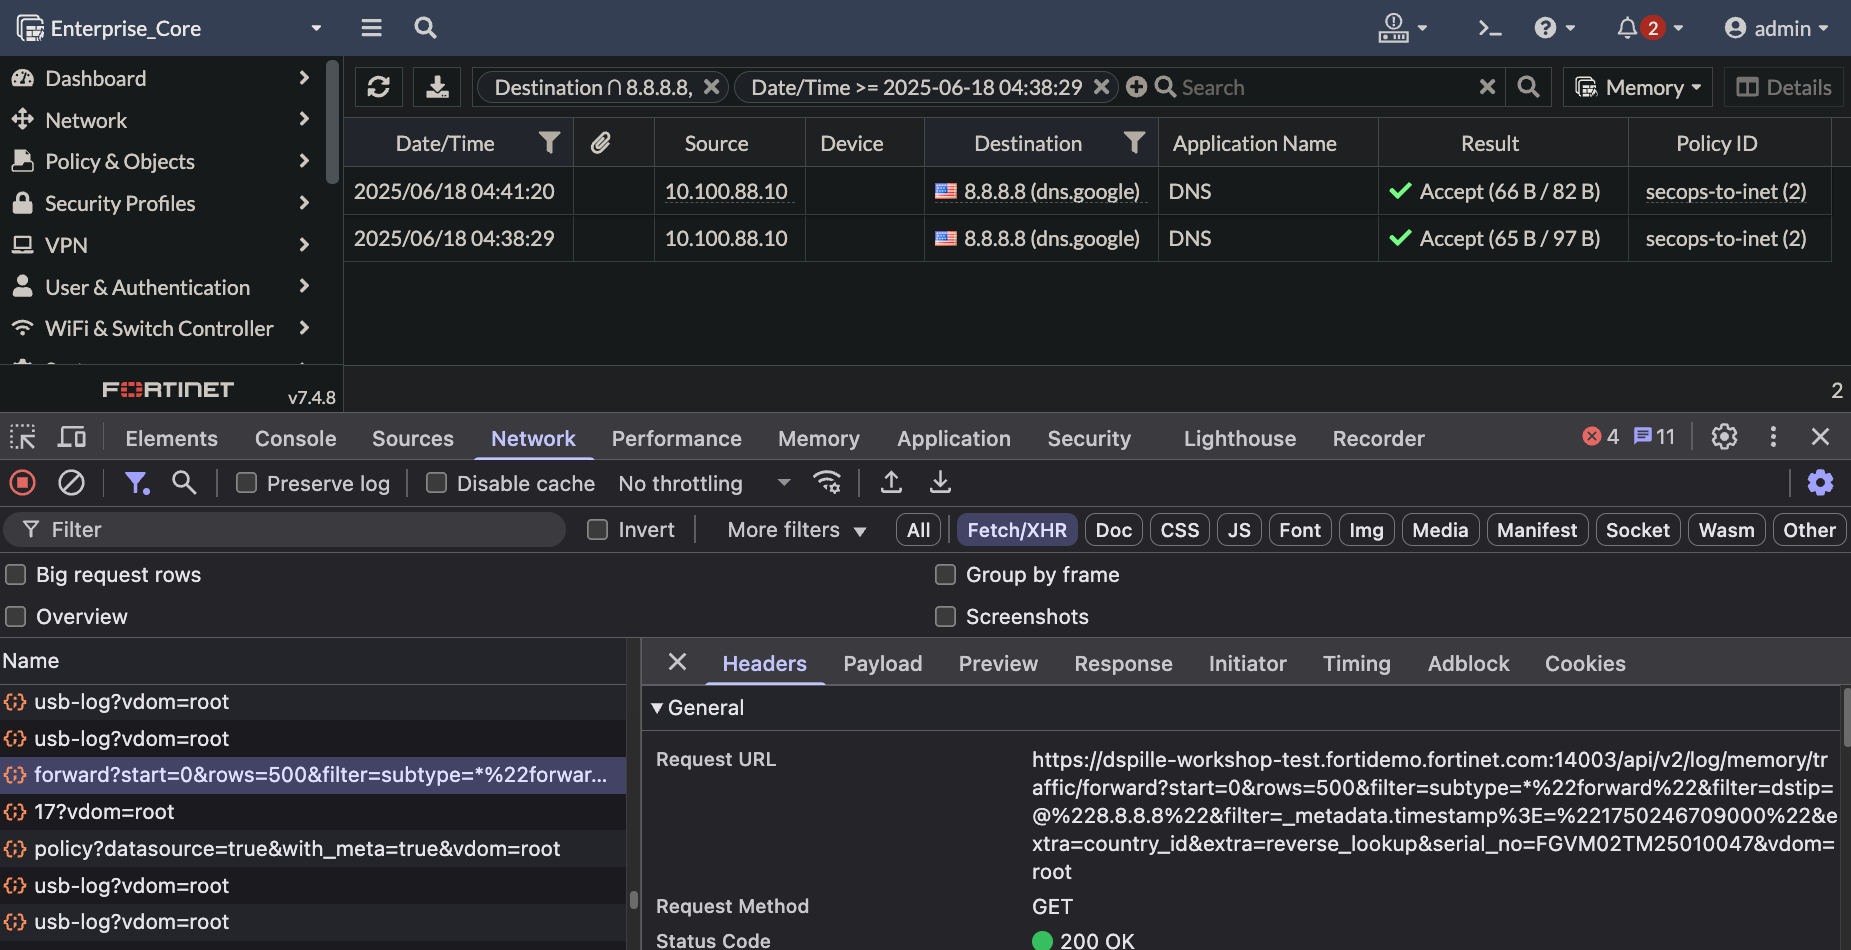
/api/v2/log/memory/traffic/forward?start=0&rows=500&filter=subtype=*%22forward%22&filter=dstip=@%228.8.8.8%22&filter=_metadata.timestamp%3E=%221750246709000%22Translated to FMG sys/proxy/json, the data looks like this. Notice the placeholders I’ve left in for dstip and epoch timestamp
/sys/proxy/json{
"action": "get",
"resource": "/api/v2/log/memory/traffic/forward?start=0&rows=100&filter=subtype=*%22forward%22&filter=dstip=@%22{{dstip}}%22&filter=_metadata.timestamp%3E=%22{{timestamp}}%22",
"target": [
"adom/root/device/Enterprise_Core"
]
}